Future Work
Using this as a test case, I believe there are substantial opportunities to expand on this approach in more programmatic, non-proprietary ways.
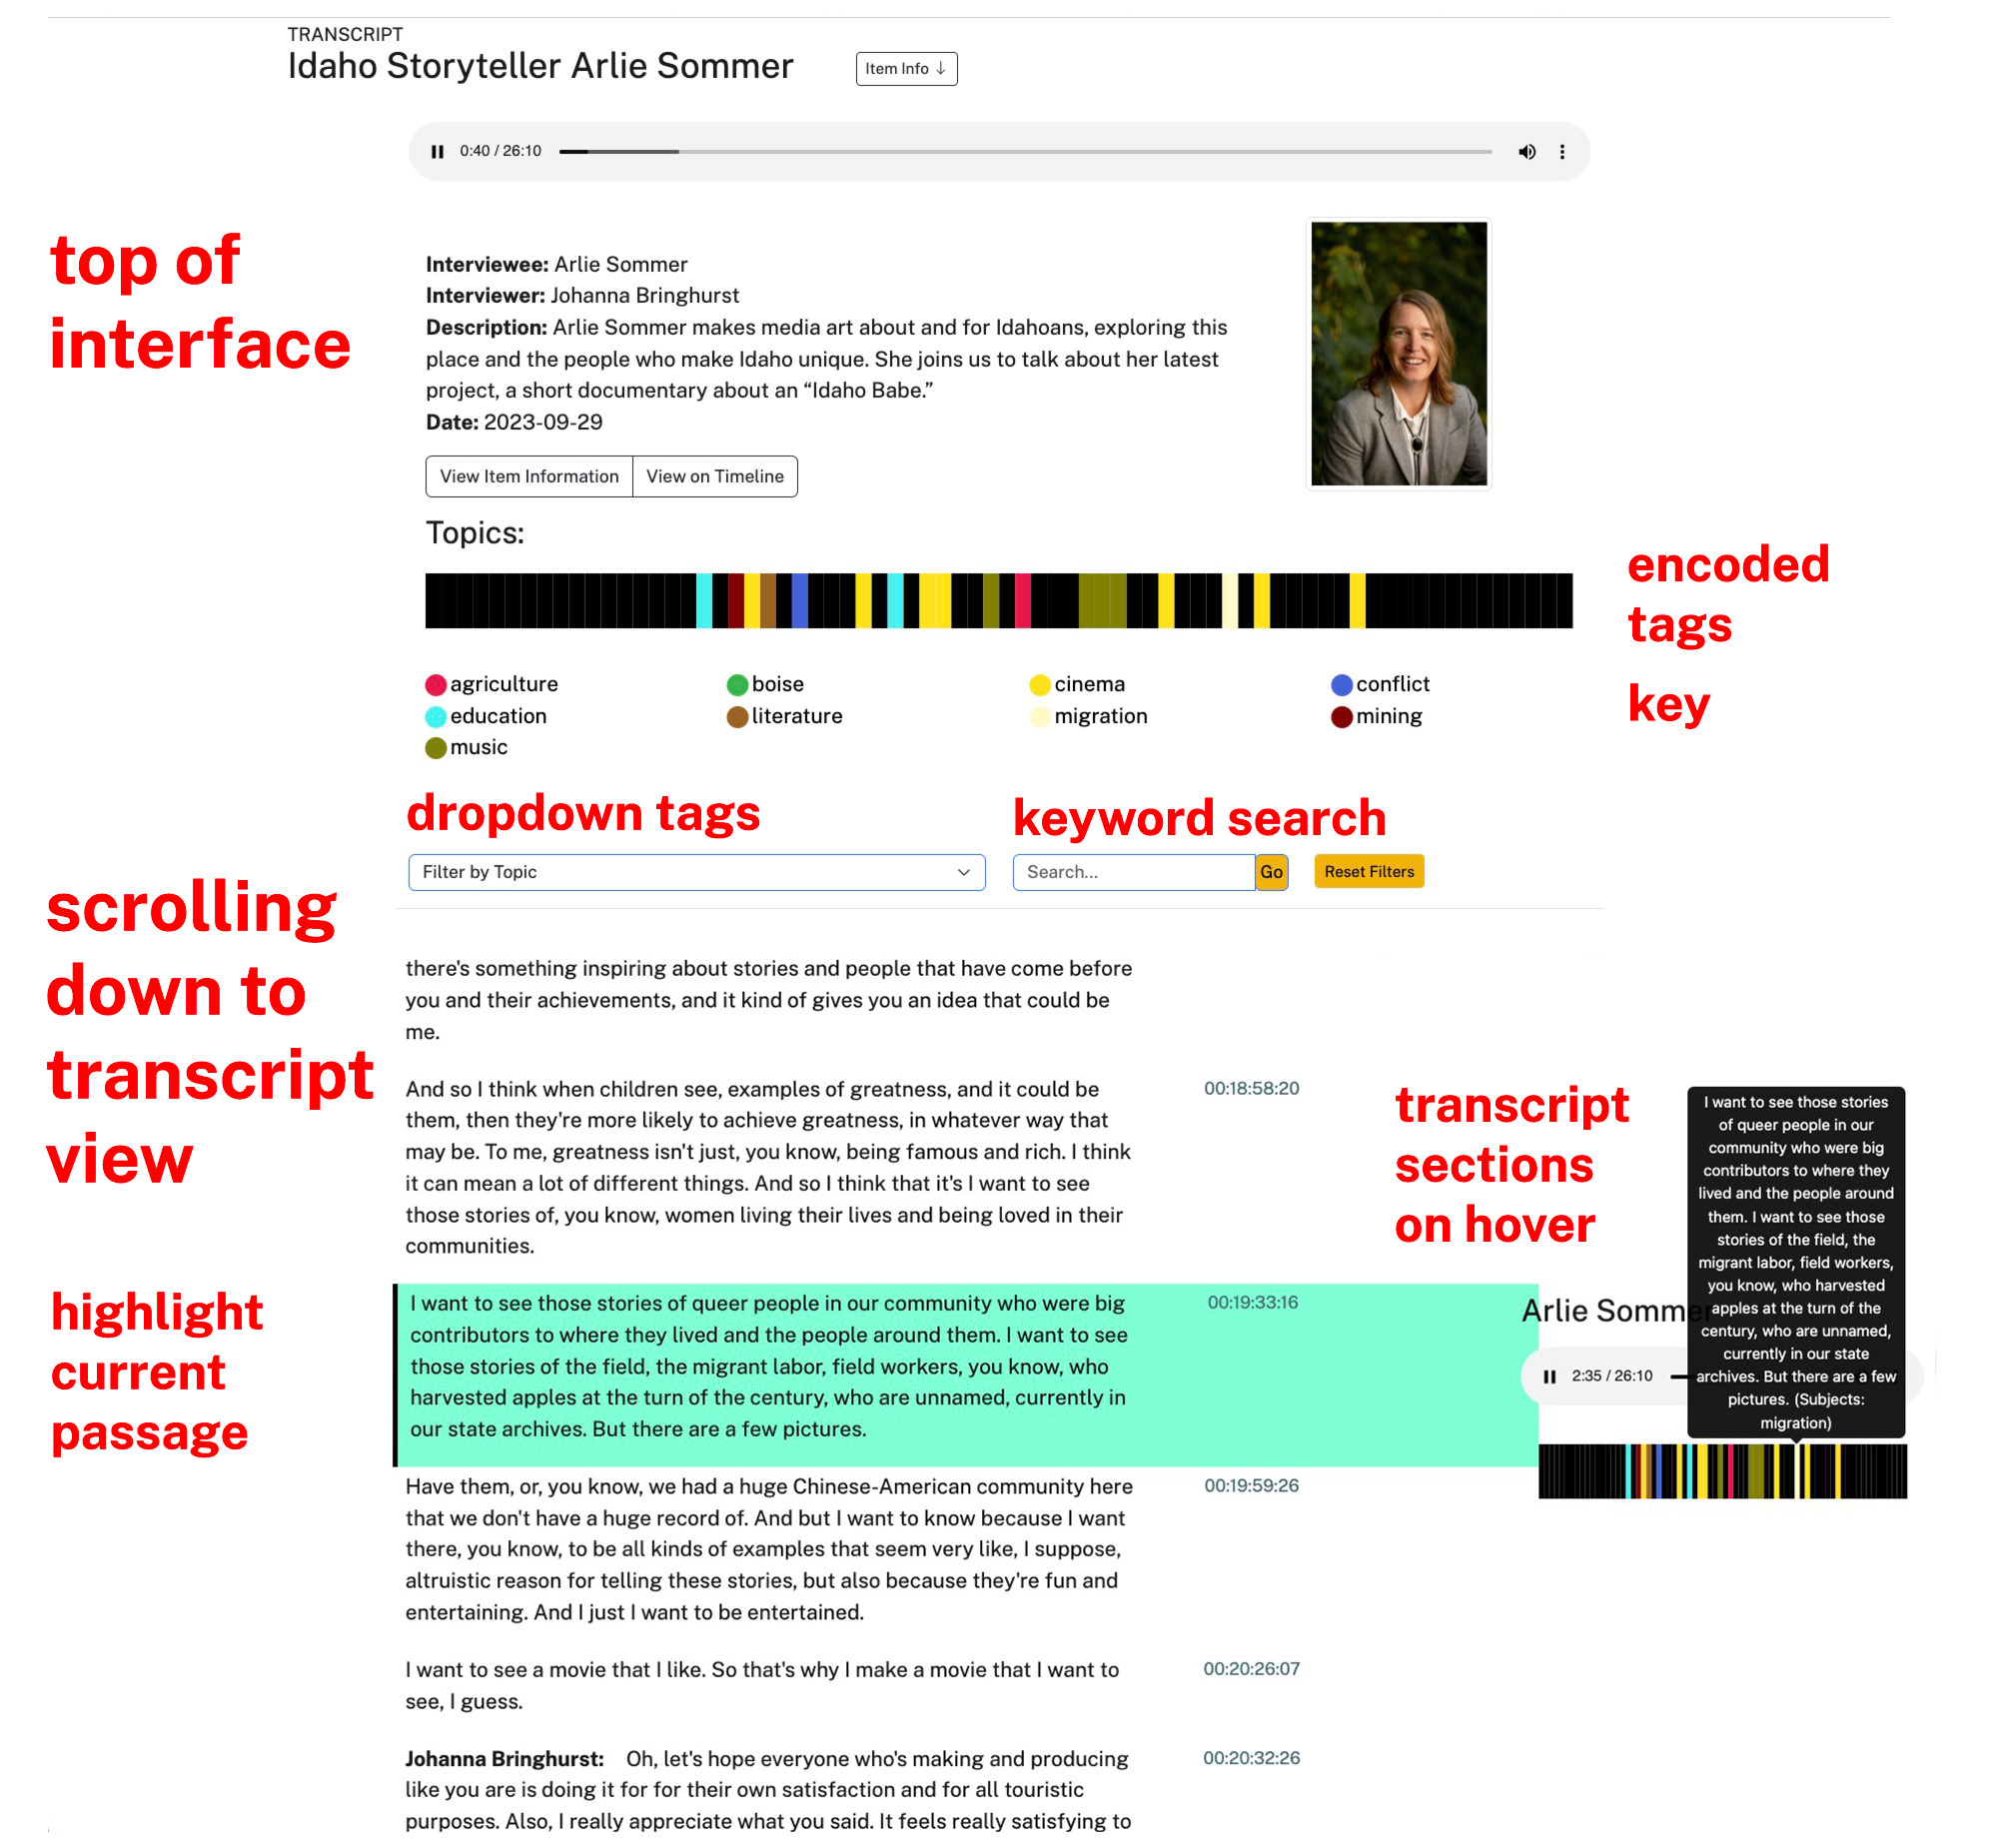
The Oral History as Data template developed by the CDIL, which was used to host and visualize the Taylor recordings is powered by enriched data, in the form of CSV transcripts with start and end timestamps for each section of dialogue, as well as tag fields along the rows where those subjects are brought up in conversation.
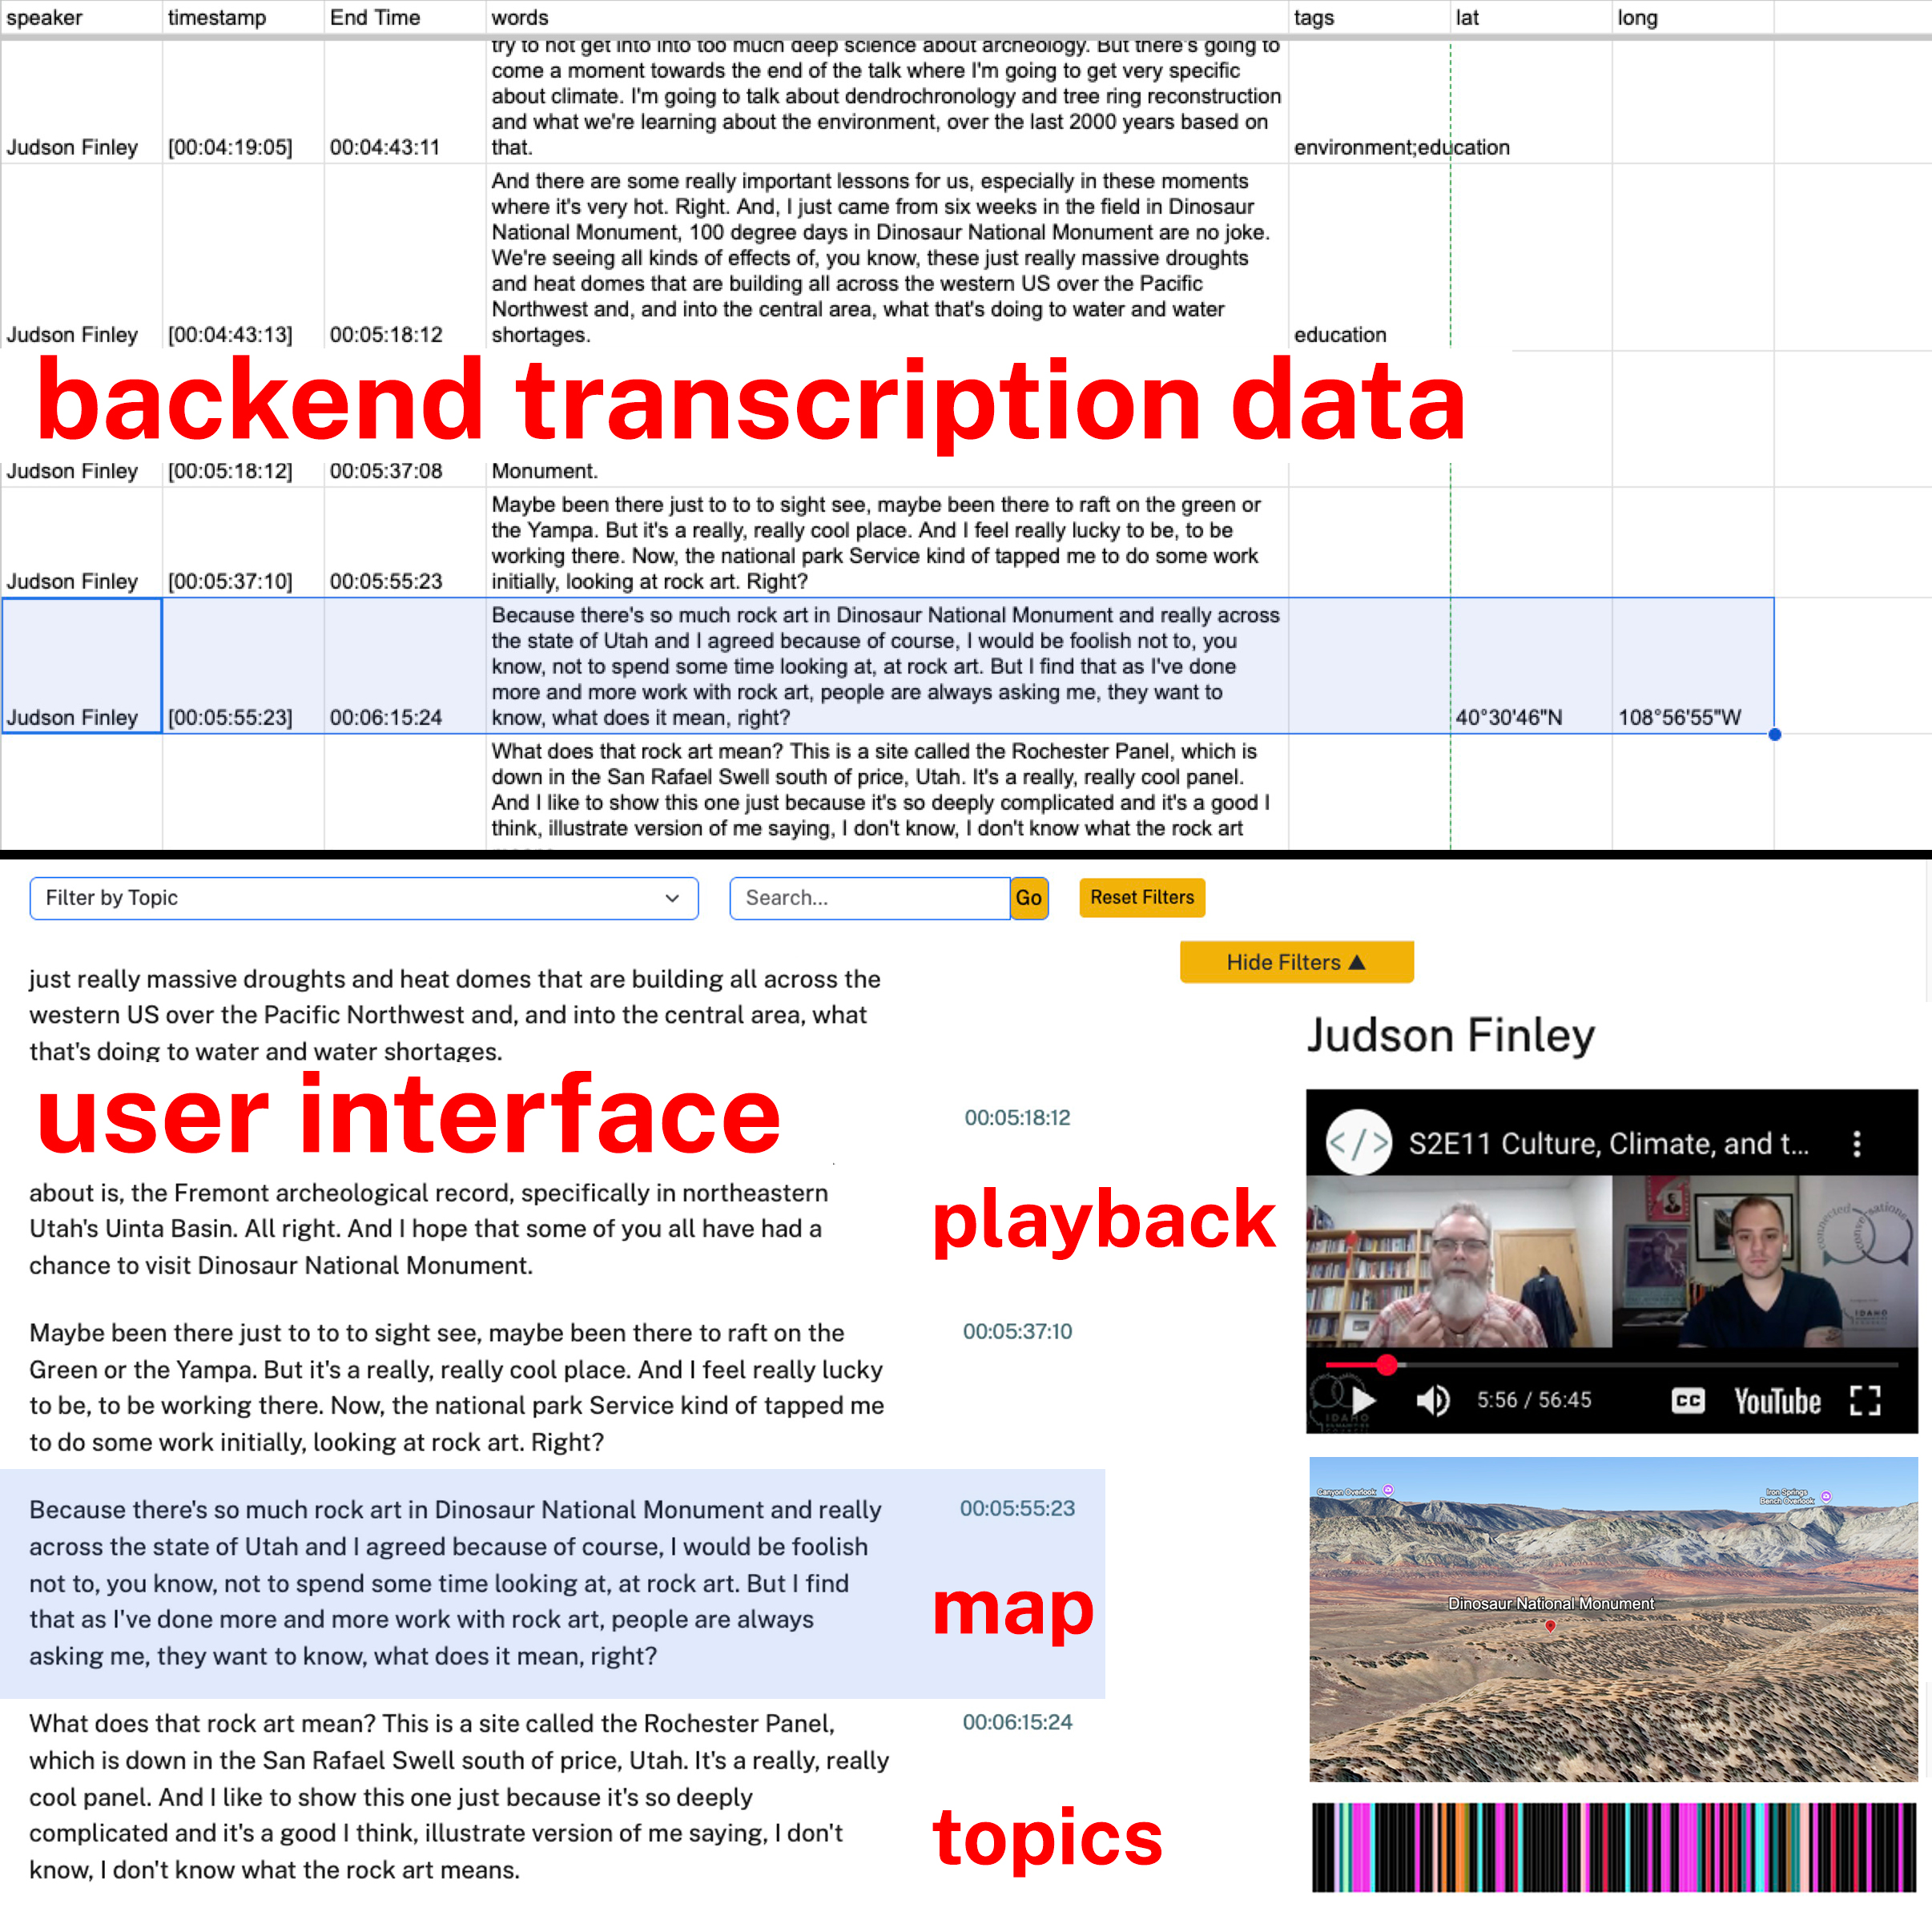
It seems plausible to simply add a geographical coordinate field in the CSV on the line of dialogue where the location is mentioned, which triggers a placemarker on a map displayed next to the transcript in the interface. The maps that we use in the Oral History as Data and CollectionBuilder platforms are Leaflet, “an open-source JavaScript library for mobile-friendly interactive maps.” This would just be another smaller interface which follows the conversation of the oral history recording, as opposed to the map page, which is informed by the geographic metadata of the collection’s items.
✺
That said, Leaflet is a two dimensional, overhead map and one could argue that something is lost by not having the three dimensional context of the physical terrain that we have in the two previous examples.
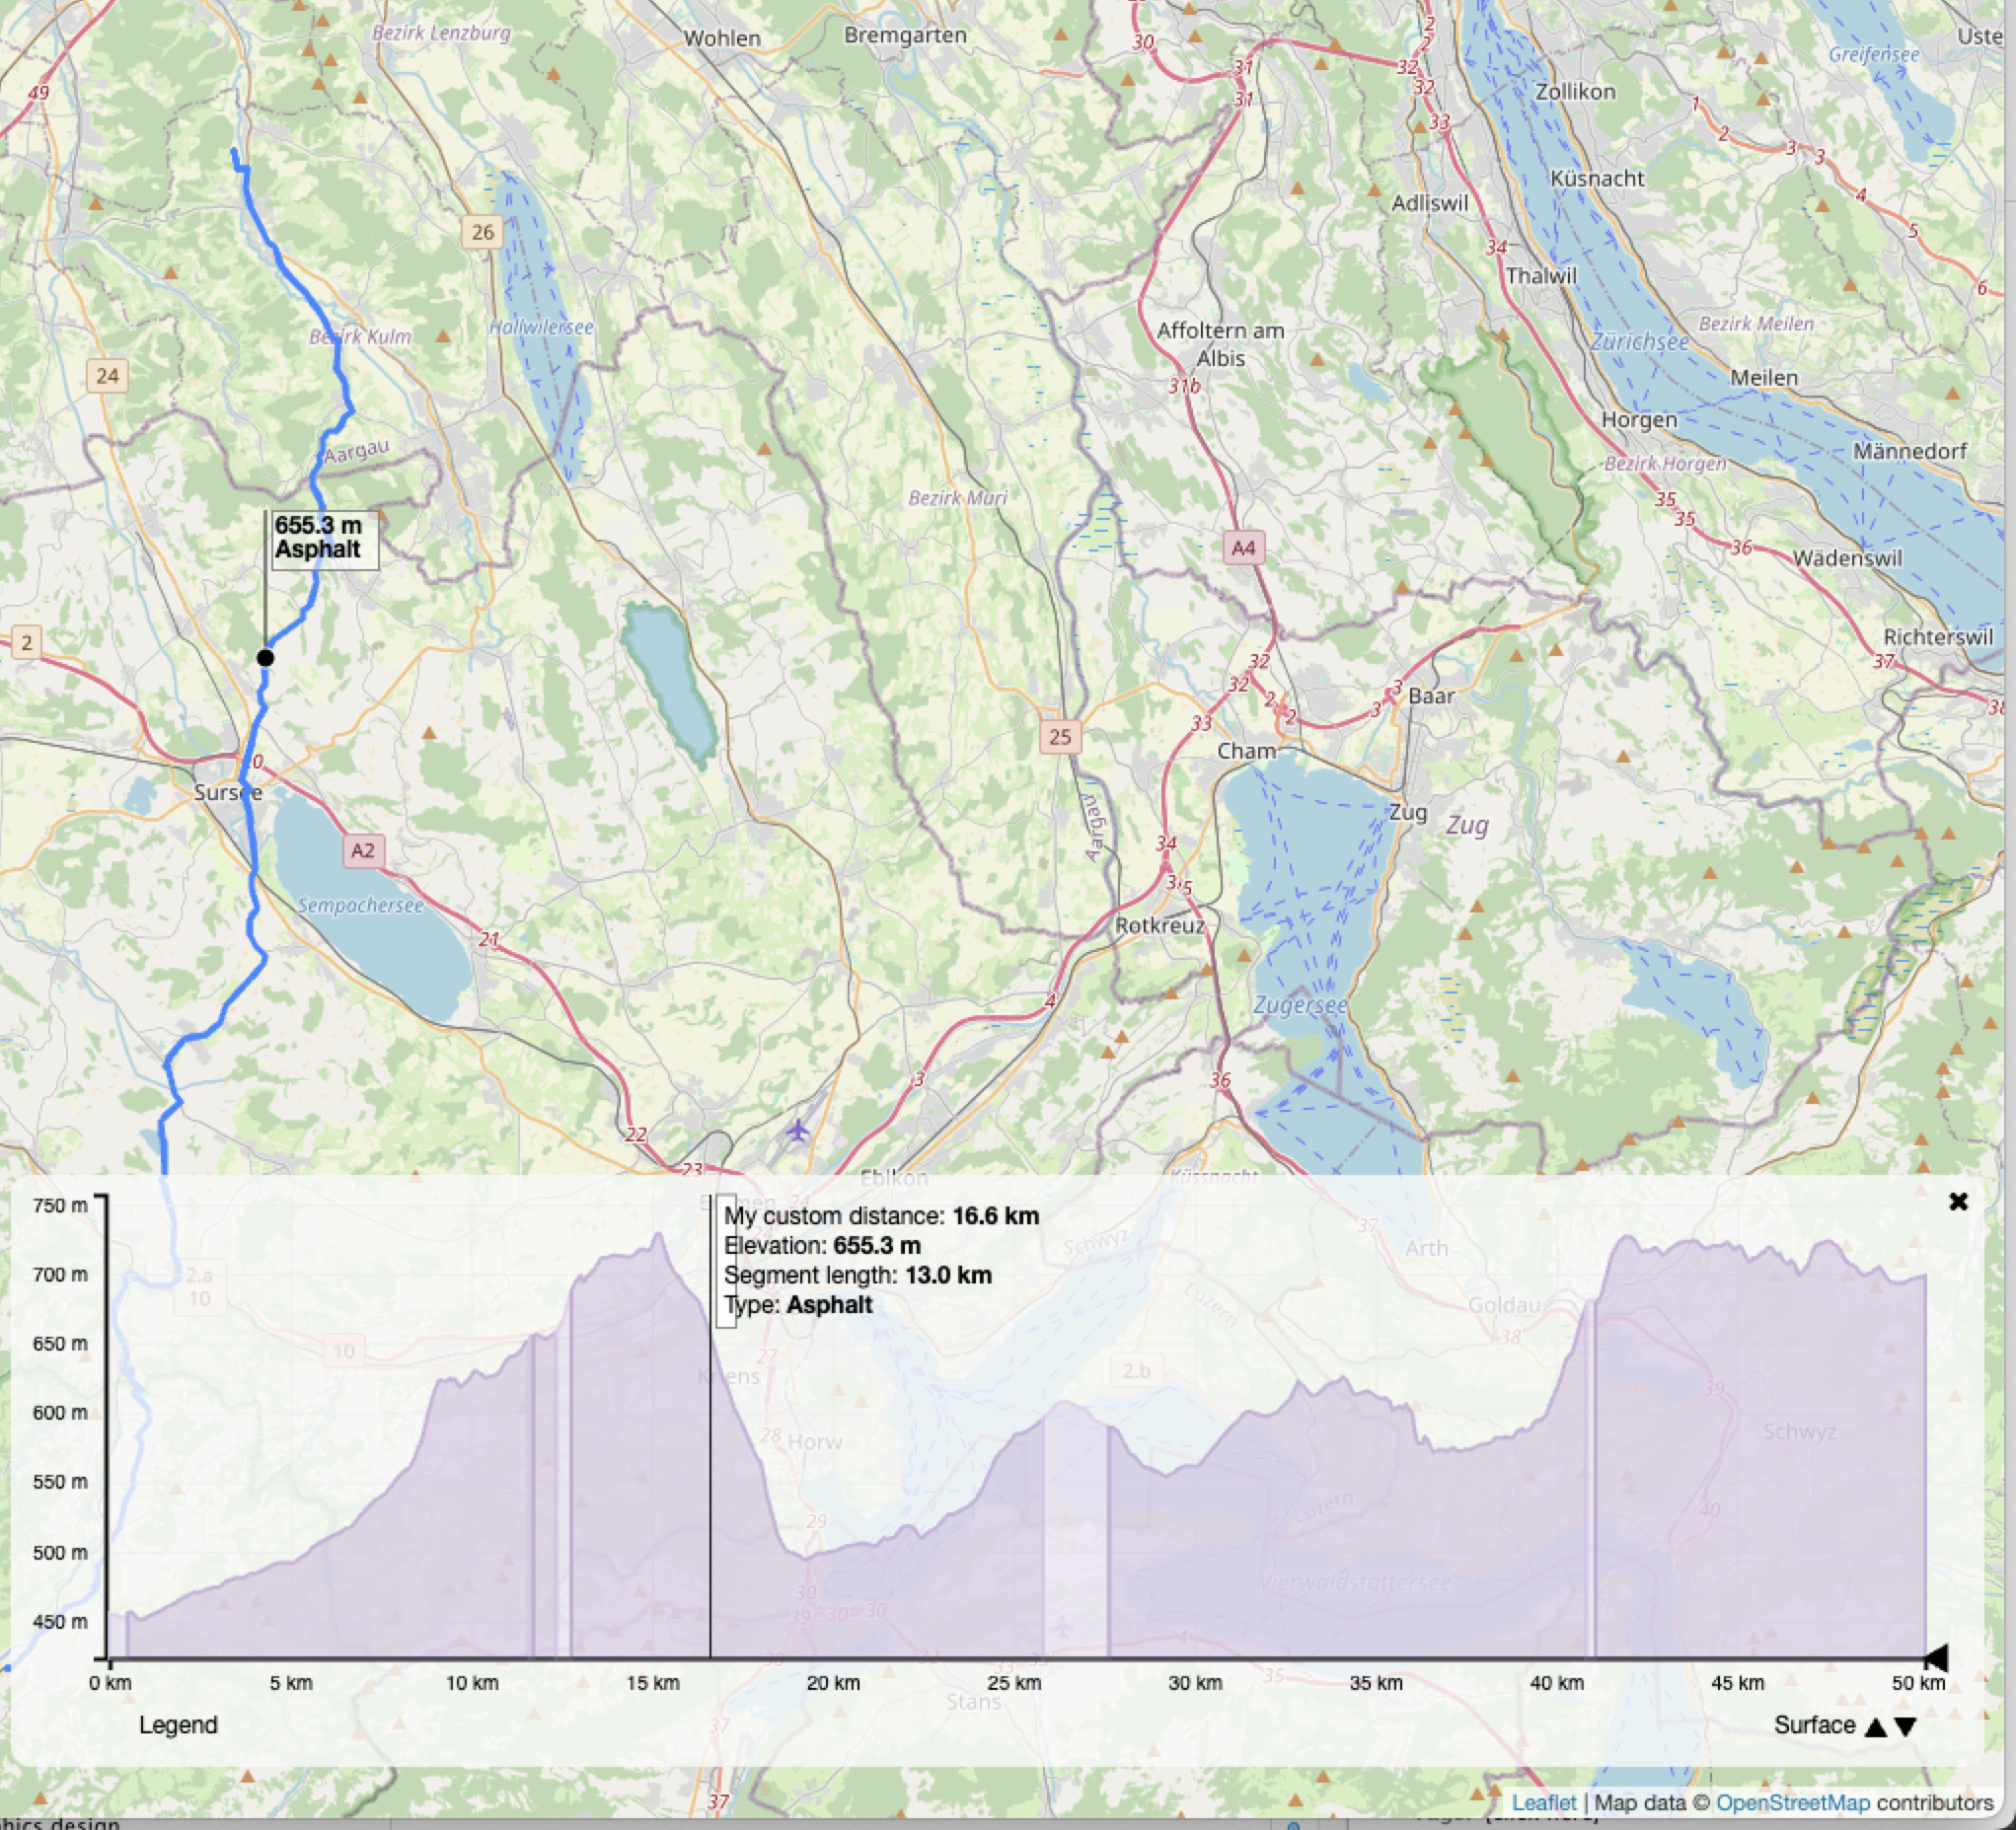
Potential solutions include using topographical Leaflet “skins” that visualize the elevation along the path of place markers alongside a traditional overhead map, such as Height Graph and the slightly more chaotic Leaflet-Elevation.js. For true 3D rendering, CesiumJS and Deck.gl are possible, non-proprietary alternatives to Google Earth Studio that can be embedded programmatically in JavaScript, just as we are with Leaflet.
Embedding the maps programmatically and tying the geographic data to the timestamps where they are mentioned means users can go backwards, forwards and repeat as needed in the transcript rather than the linear momentum of a standard media player. Allowing researchers to essentially scratch the record back and forth on these recordings, in concert with the geographical data or drop directly into visualized subject tags, moves beyond passive narrative engagement and into interactive experimentation with research materials. William G. Thomas describes this ideal digital scholarship learning environment as one where “the reader can immerse him/herself in the past, surrounded with the evidence, and … build connections versus the narrative anticipation of what comes next.”
✺
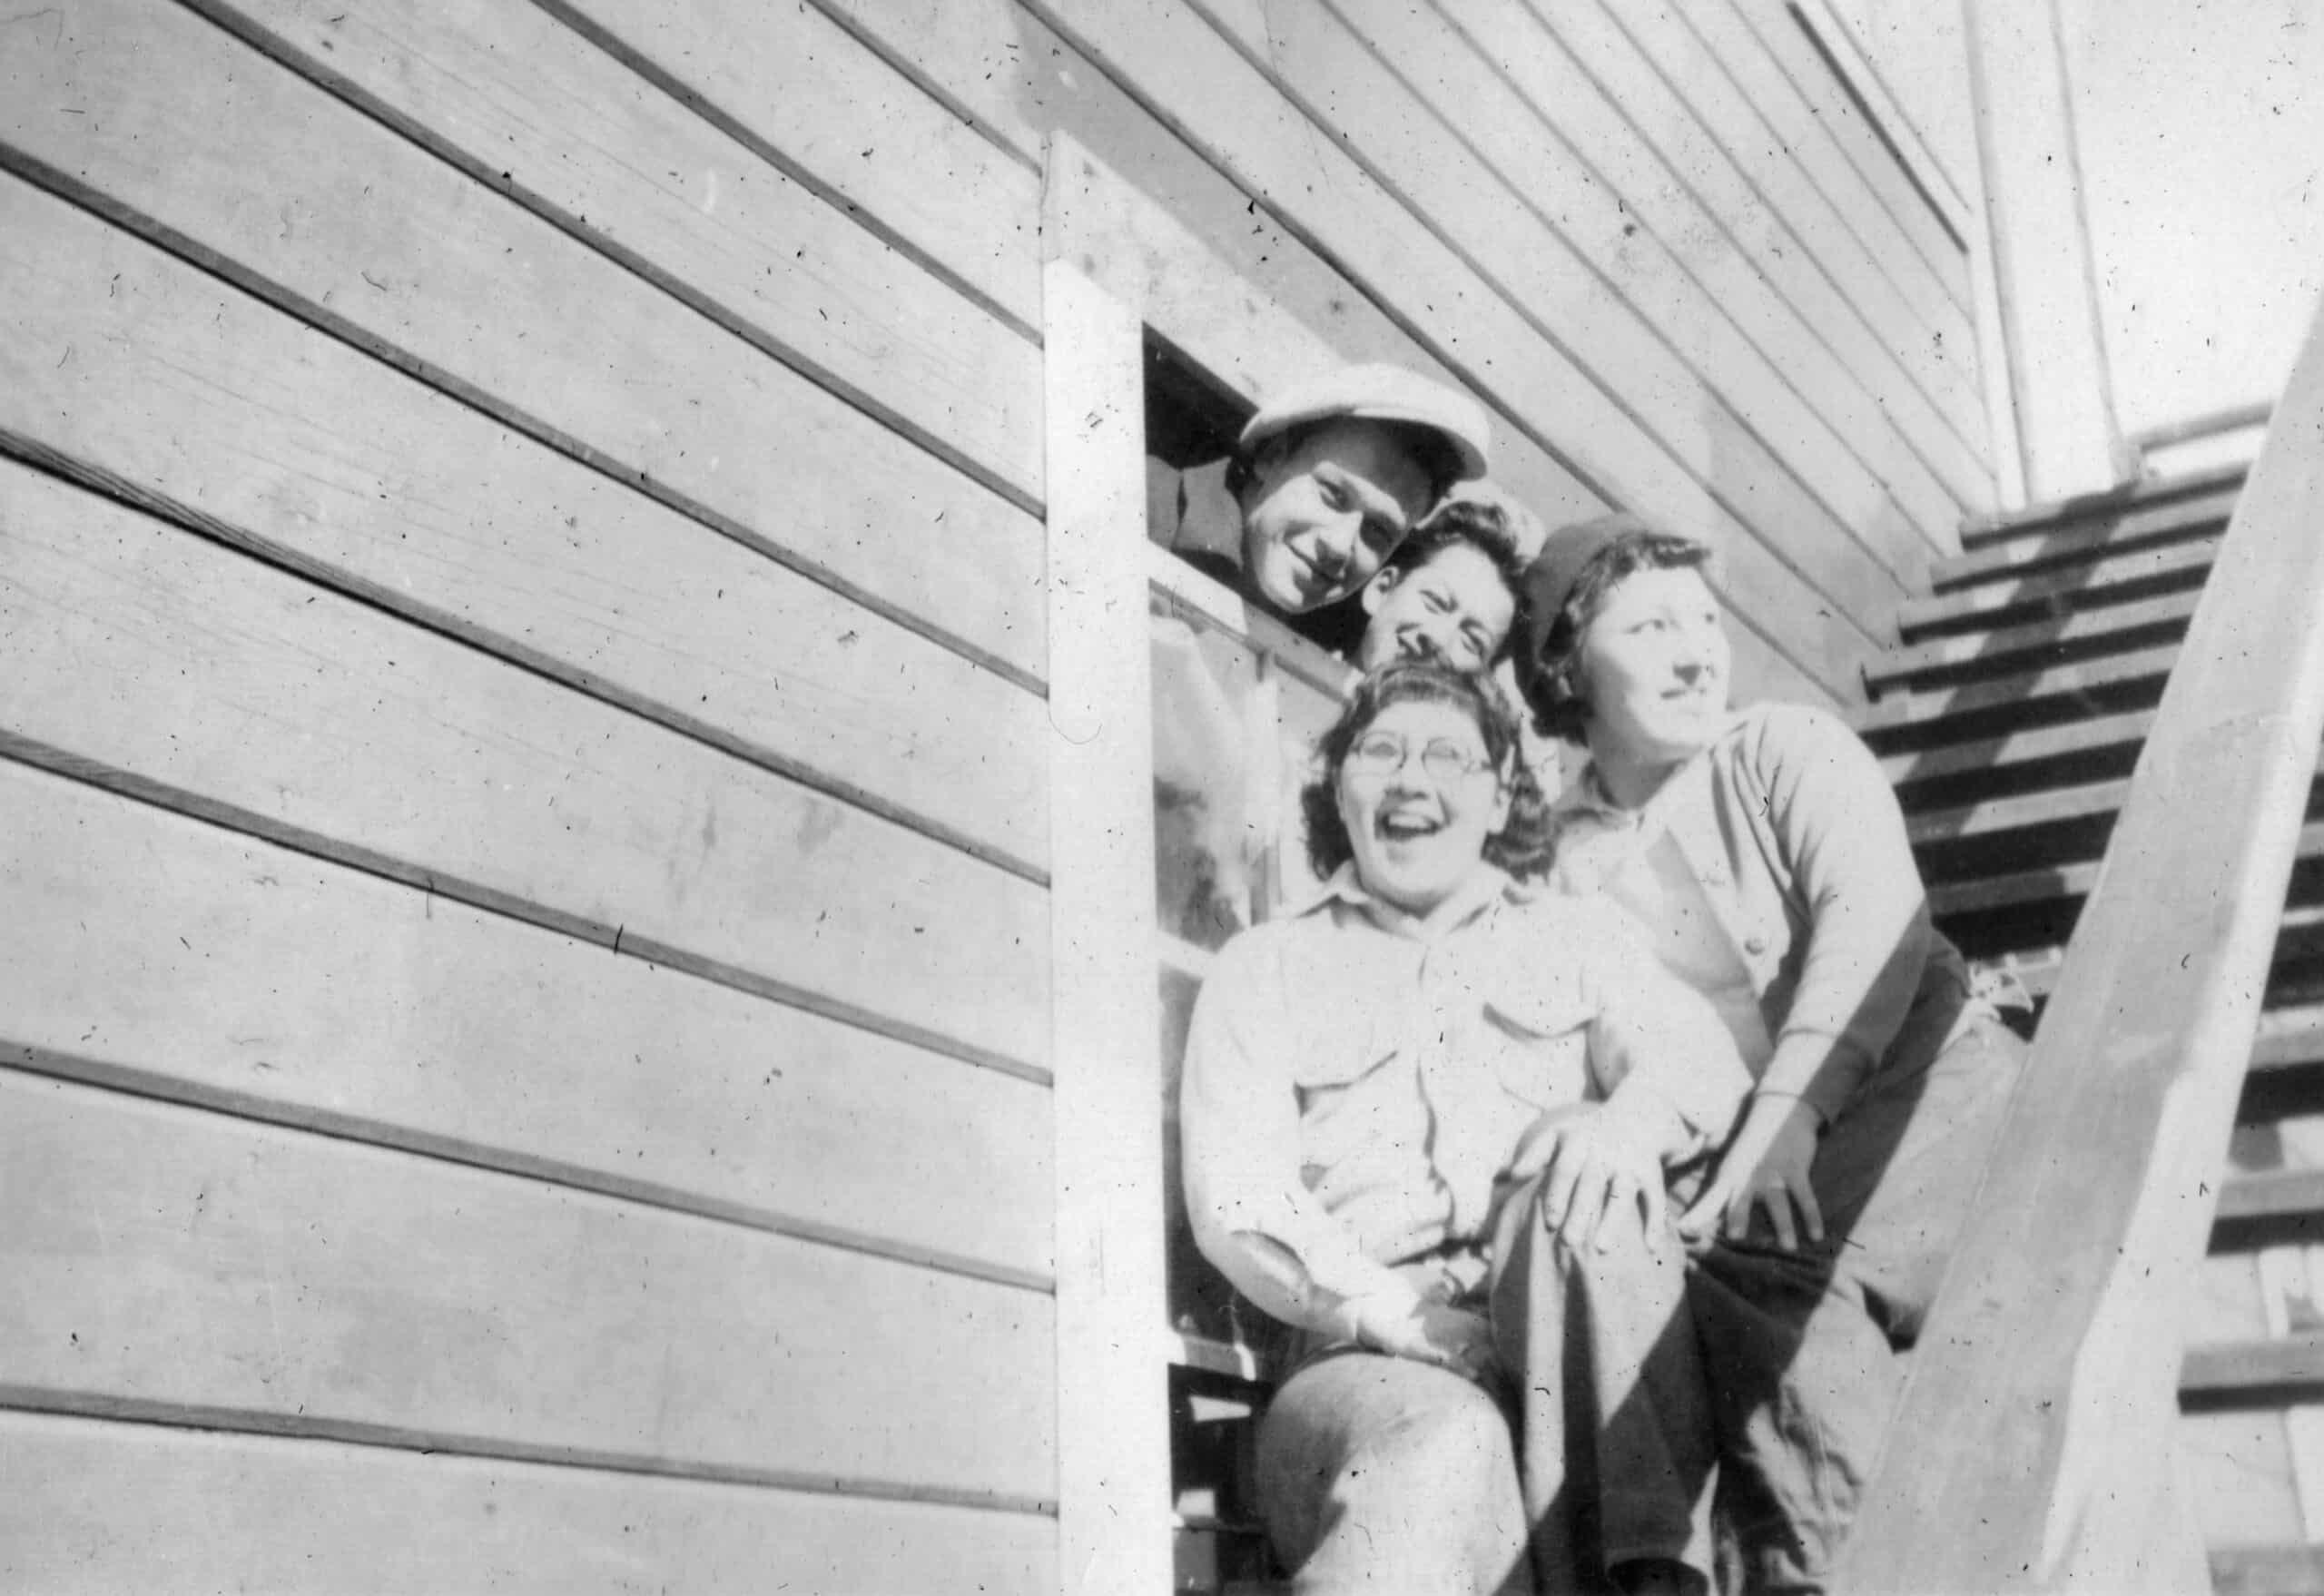
If we can integrate this geographic element into our OHD template, there are incredible opportunities to enhance audio and video archival resources. In the same way that these videos helped viewer comprehension of a remote area in the Taylor collection, many oral history collections would benefit from a clearer understanding of how distance shapes historical context. A project I’ve previously worked on documented the life of an “Alaskero,” a Filipino-American who worked in the Alaskan salmon canneries. Oral history recordings from similar migratory workers could be enhanced by visualizing the incredible distance that make up migratory circuits along Puyallup hop farms, lumber mills in Grays Harbor, and the canneries of Alaska.
✺
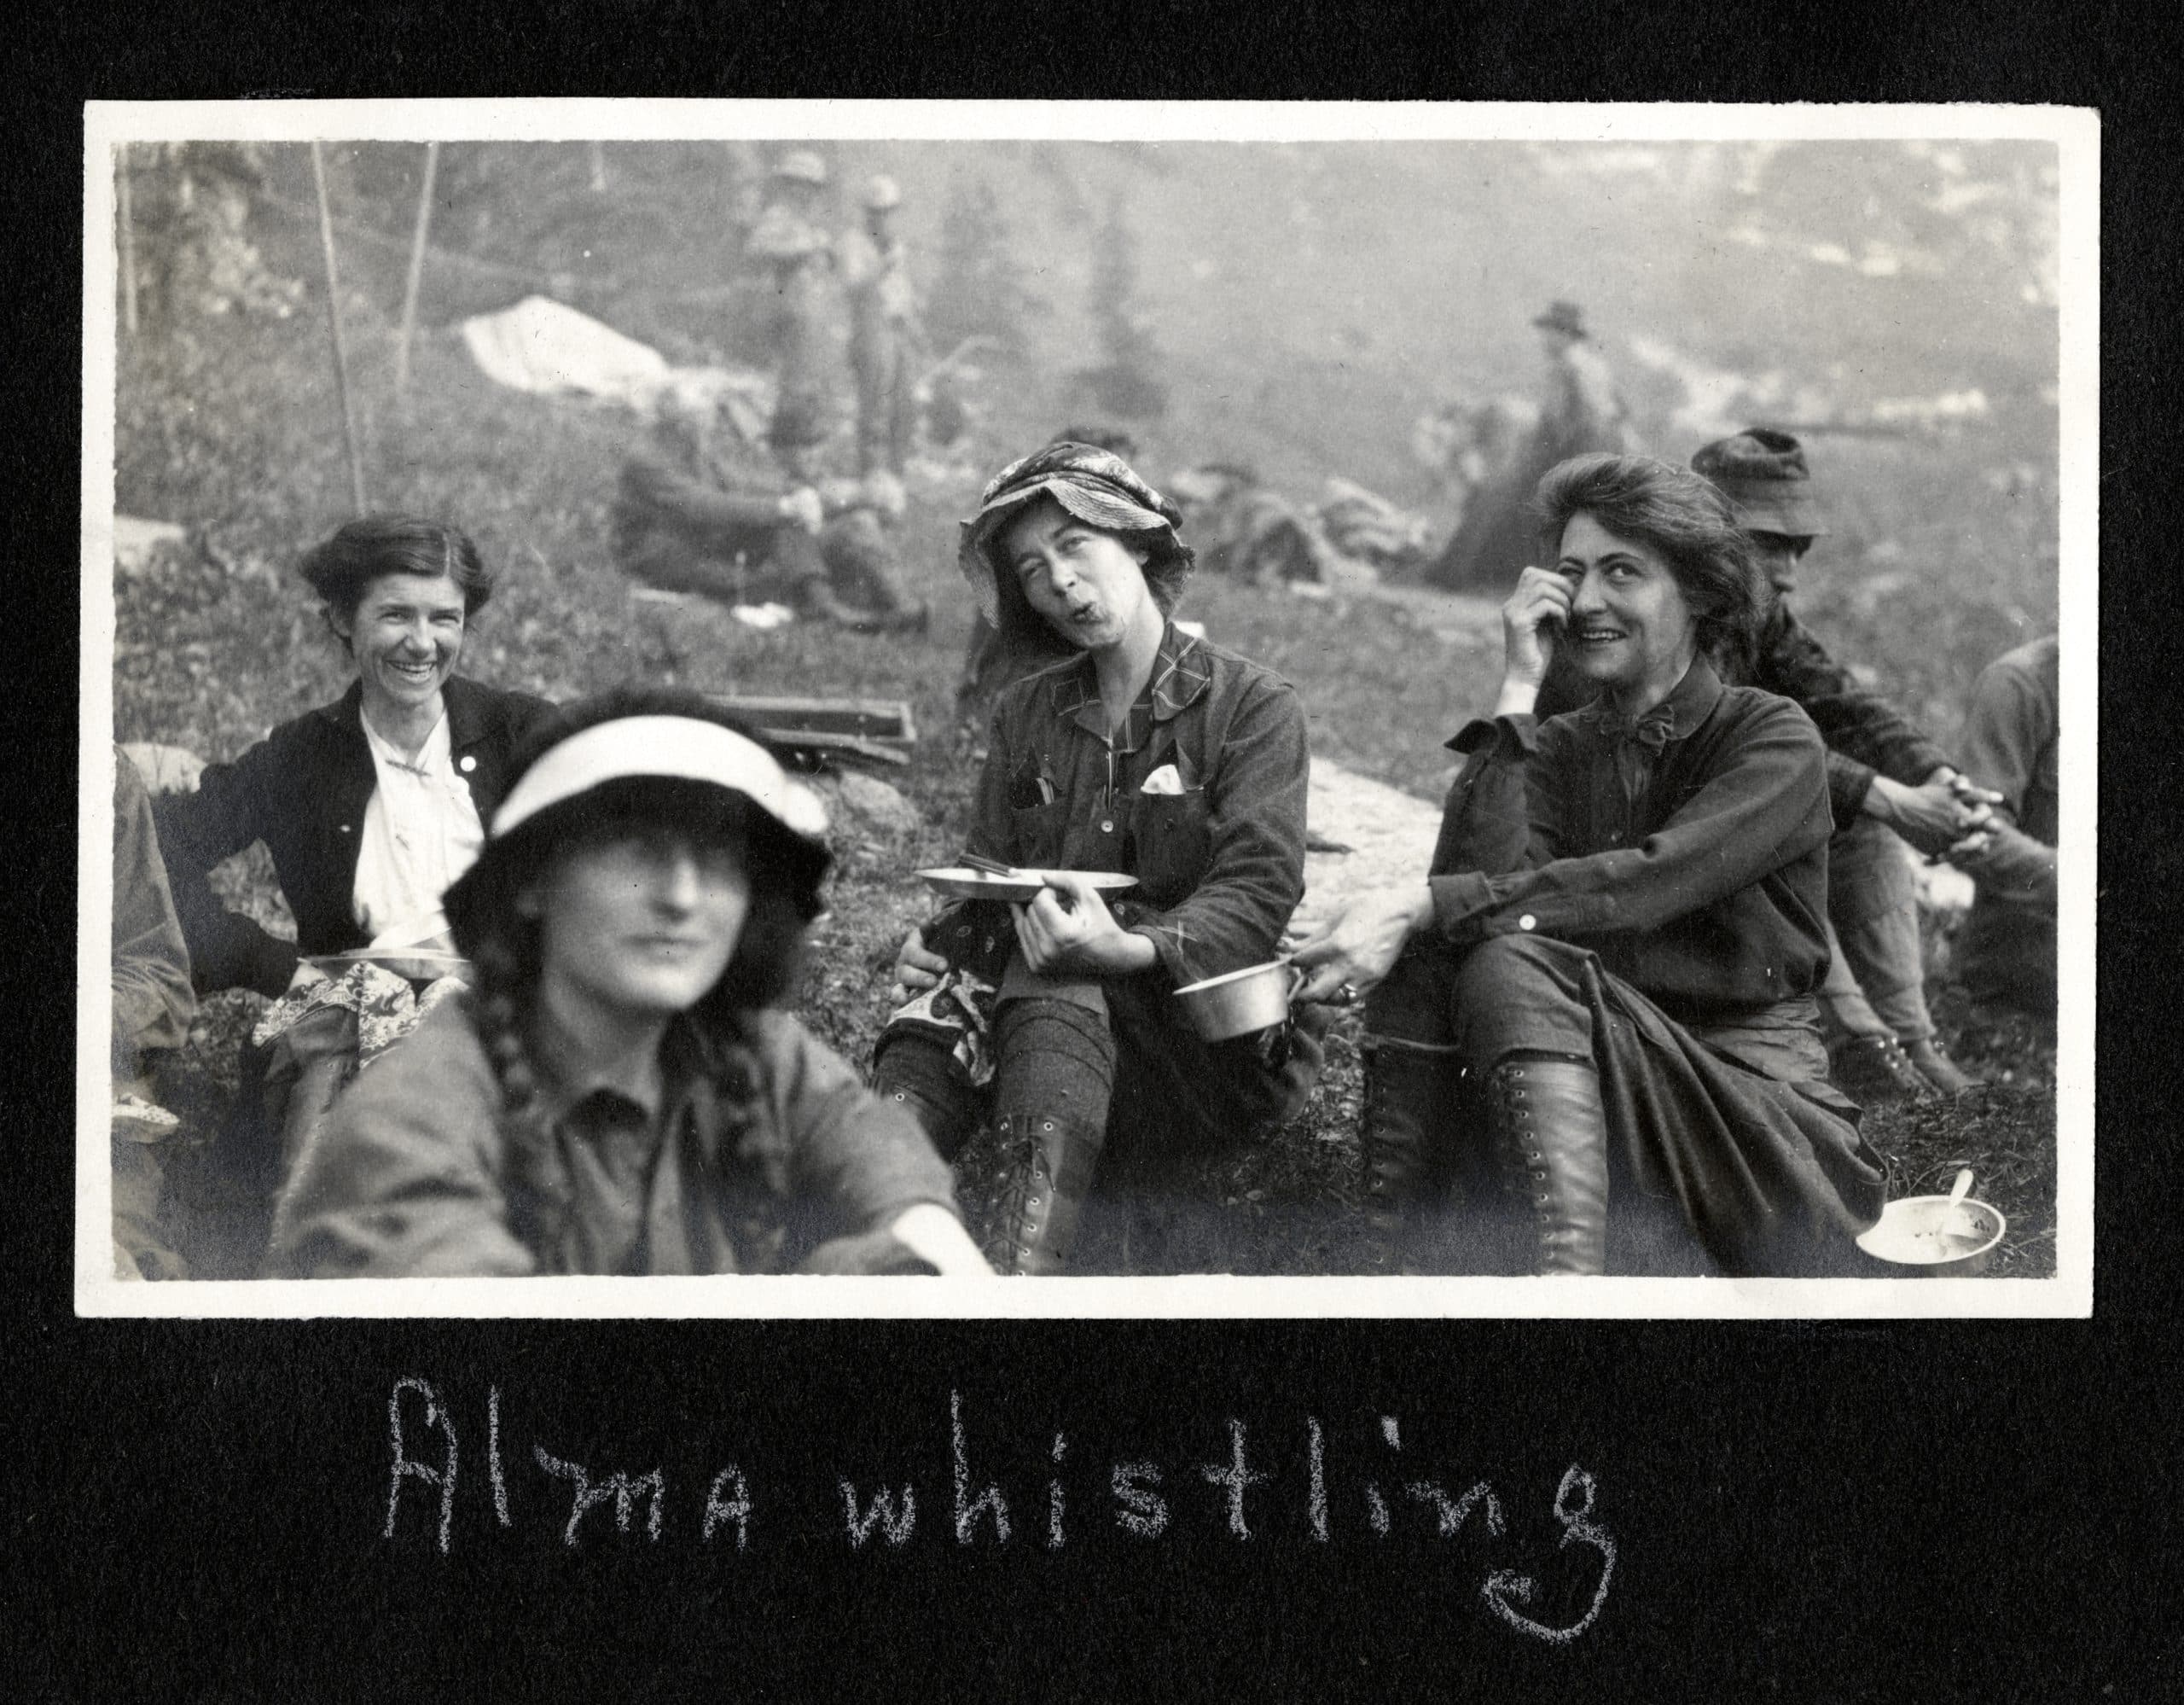
There’s also an opportunity to combine oral history and mapping to make new insights around environmental history. Another digital initiative I contributed to, highlighted and geolocated the expeditions of the Tacoma Mountaineers, a women’s back-to-the-land hiking organization that formed in 1906 and used their monumental summits to promote suffrage. Mapping these expeditions as their being recounted in oral history recordings and contrasting the environment as it was in photos taken by the Mountaineers to how they are now in 3D renderings could help make evident stark contrasts in urban development, environmental policy change, access to public lands and, in direct effect, the public’s inability to organize for political empowerment.
✺
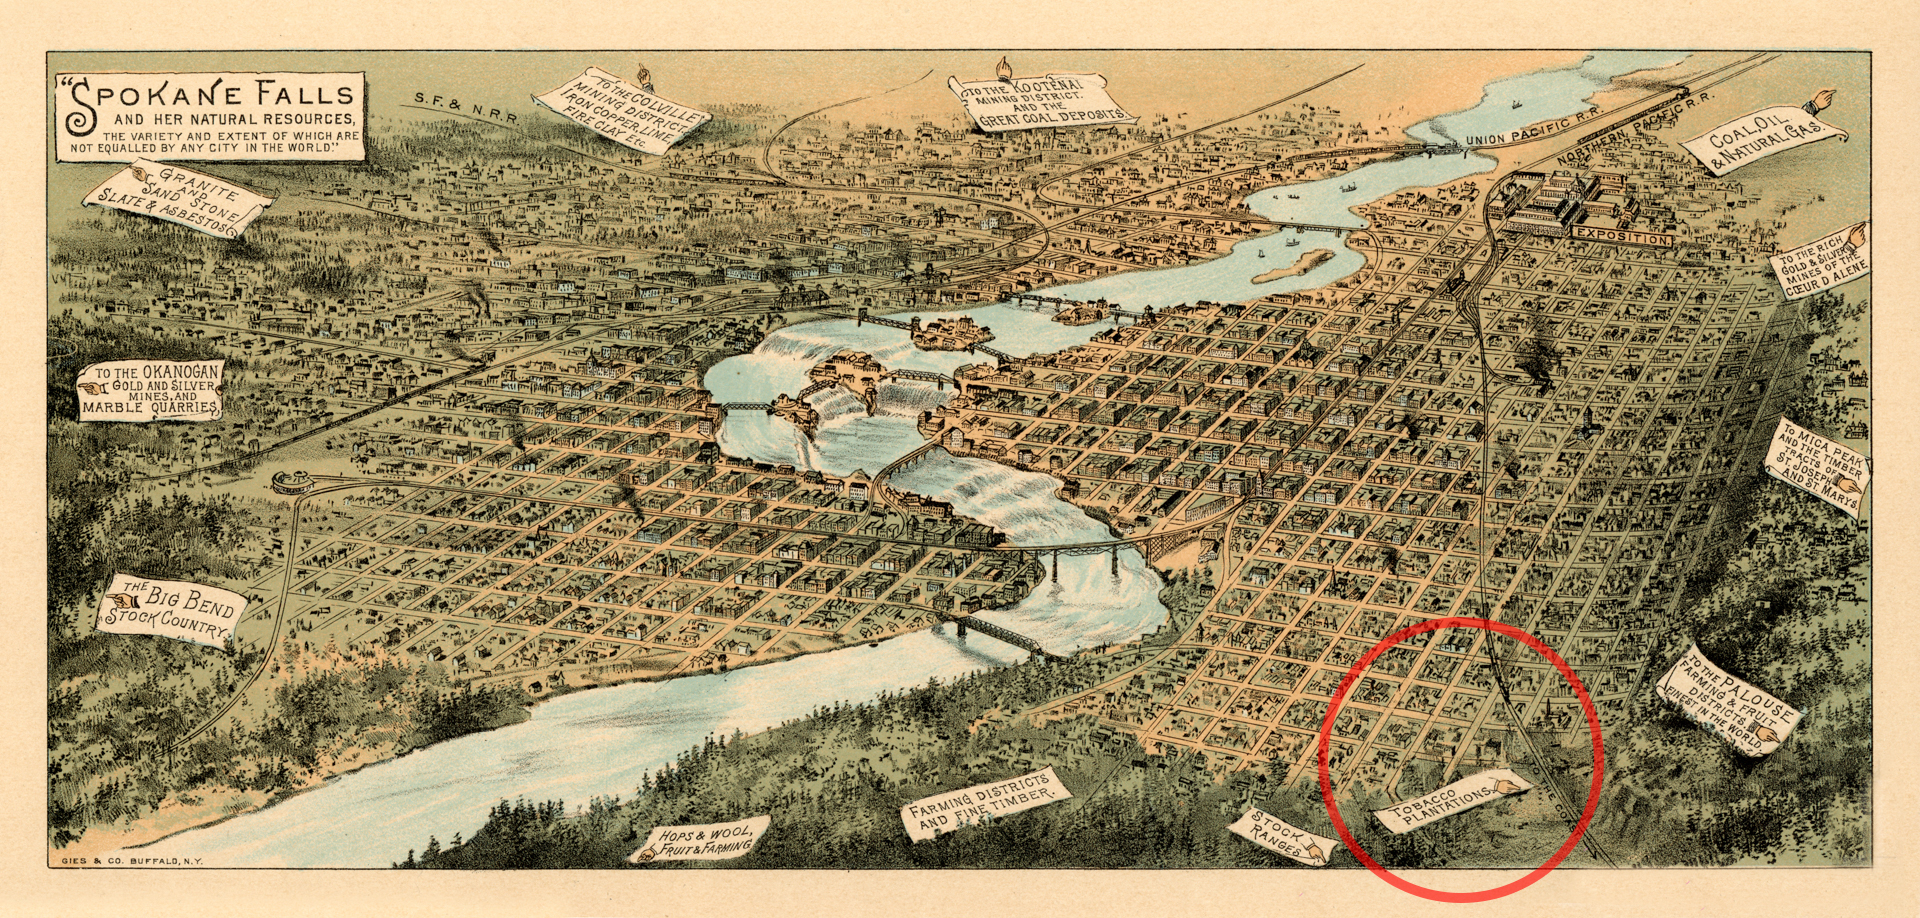
Regarding corporate history and urban development, there may also be new insights gleaned by comparing different geographic “skins” within the same map to add context to oral history recordings. These could be aerial photos arranged chronologically to understand change over time. These could also incorporate “marketing maps” created by boosters and real estate agents to attract potential investors. One example is a map titled Spokane Falls and Her Natural Resources, commissioned by investors for the 1890 Northwestern Industrial Exposition. Not only does the map not account for the Great Fire, which destroyed most of downtown Spokane less than a year earlier, it also depicts a tobacco plantation alongside the timber and hops resources, a crop that could never actually be maintained in the Palouse environment invented in whole cloth to attract southern investors to the area.
A more recent example of a map projecting real estate imagination rather than reflecting reality is discussed in Maharawal and McElroy’s The Anti-Eviction Mapping Project from 2018, describing a map created by the “luxury apartment complex NEMA—located in the “Twitter Tax Break Zone,” …. which erased Chinatown and the largely working-class southern neighborhoods of the city, and renamed the Castro, a historically gay neighborhood, as Eureka Valley.” Oral history projects that incorporate both early aerial maps, these “fantasy maps” and present day geographies can help us understand the ways that these imaginings of the very few may have become the reality for many.
✺
More abstractly, I believe there are fresh insights that could be understood by combining oral history recordings and mapping regarding memory studies. The methodology “argues that the so-called unreliability of memory is also its strength, and that the subjectivity of memory provides clues not only about the meanings of historical experience, but also about the relationships between past and present, between memory and personal identity and between individual and collective memory.” Mapping oral history allows historians to create a visualization of an interviewee’s memory, understanding the their associations between one place to another, with positive or negative sentiments, and whether their feelings toward that place were shaped by societal narratives or personal experiences.
✺
Conclusion
My initial detachment from the physical landscape of the Taylor Wilderness Research Station highlighted a broader challenge to people tasked with designing digital collections for public engagement: when digital collections are built without meaningful geographic context, both creators and users may risk misunderstanding or overlooking the significance of the work.
What began as an emergency digitization initiative evolved into a multifaceted digital collection that reflects both the scientific output and human dimension of Taylor Ranch. The project underscores the importance of intentional interpretation in digital initiatives, serving not only as a preservation effort but also as a model for how contextual layering can deepen the value and usability of digital archives.
About the Author
Andrew Weymouth is the Digital Initiatives Librarian at University of Idaho, primarily focusing on static web design to curate the institution’s special collections and partner with faculty and graduate students on fellowship projects. He has also created digital scholarship projects for the universities of Oregon, Washington and the Tacoma Northwest Room archives, ranging from long form audio public history to architectural databases and network visualizations. He writes about labor, architecture, underrepresented communities and using digital scholarship methods to survey equity in archival collections.