Bibliometrics
Once these metadata issues were resolved, I was able to start on the first digital scholarship aspect of the project. Bibliometrics are the use of statistical methods to analyze books, articles and other publications. The concept was to see if there was some way to visualize all of the academic work that came out of Taylor to convey a sense of the institution’s “research impact” over time.
Using Web of Science, I was faced with my first question around balancing the validity and the sufficiency of data that you often encounter in these types of projects. In this case, I found that searching for specific names of the scientific papers in Web of Science wasn’t yielding many results – mainly due to their data focusing heavily towards papers published in the late 90s onward, with the majority of the Taylor archive papers published in the 70s and 80s largely absent.
✺

Approach
This led me to consider some questions:
-
What does it mean for a paper to be the direct product of a specific place?
-
Does a work need to mention Taylor by name?
-
Are we only looking at research produced by U of I?
-
How long after the author visits Taylor is it still considered a product of that place?
With this in mind, I decided to zoom out a bit and look at authors from U of I who were simply present in the archive, rather than specific titles.
✺
Network Visualization
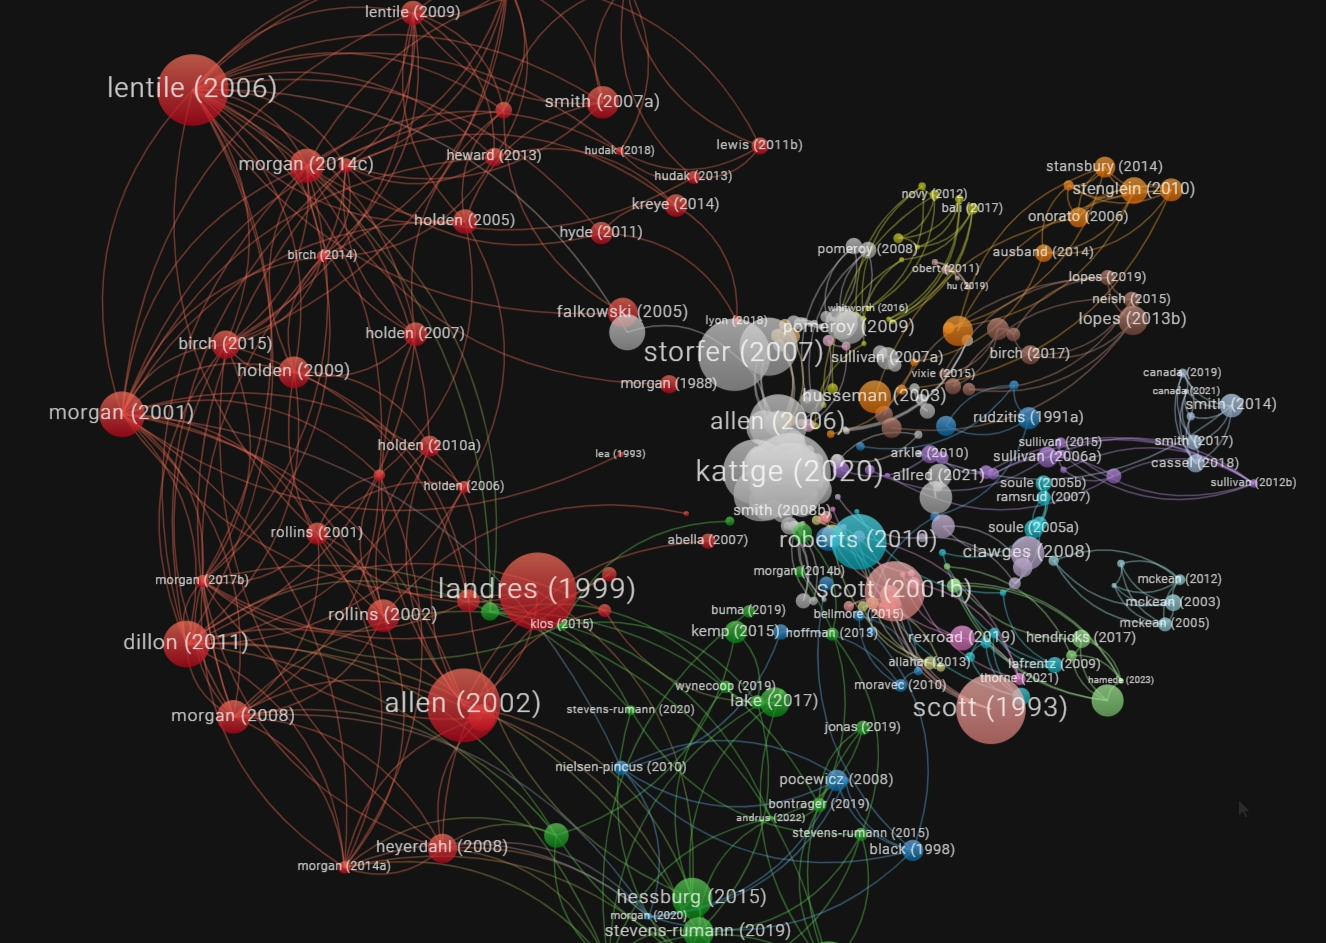
After creating an author name equation so I only needed to search for authors in seven batches of 100 names rather than a bleak 737 individual searches, this compiled Web of Science data was then exported in CSV format and then imported into VOSviewer, a Dutch, open-source network visualization platform with excellent documentation and an intuitive interface.

I wanted to analyze:
-
future citations of specific documents
-
fields of interest over time.
✺
Once these three visualizations were completed, further customization was done adjusting node color to represent scientific discipline, size to represent the number of times the work has been cited, and arrangement according to when they were published. Selecting a node brings up a pane on the lower right hand corner of the screen which reveals more details on the title and, if available, creates a link to the research paper itself.
These visualizations were then embedded into our CollectionBuilder site using the VOS-Viewer Online function. While these do take a short while to process the JSON data on loading, the bibliometrics add a colorful and interactive element that reduces a daunting amount of scholarly work into a single visualization.
✺