Introduction
Hello, I am the Digital Initiatives Librarian at University of Idaho, focusing on static web design to curate the institution’s special collections and partner with faculty and students on fellowship projects. I work on improving archival workflows, developing open source, sustainable tools to make digital collections more accurate and accessible. In the work I’ll be discussing today, I also think a good deal about how to visualize data in ways that provide added context about our digital collections for patrons at the library and students in the university.
The process I’ll be discussing has its origins in realizing a fundamental lack of understanding of the project I’d been working on for months. After transcribing hours of oral history material, processing hundreds of research papers, and combing through metadata to create a digital collection on a natural science archive, I began to recognize a critical gap. My inability to grasp the area where all of the research was conducted obscured both my understanding of the material and my connection to the people conducting the research. I also realized that if I was struggling with this understanding, patrons and researchers using this digital resource would likely also feel this disconnection.
✺
Example Project
Before we begin, I would like to share an example of a project where I felt this type of visualization added another layer of helpful context to the project I was working on. The Taylor Wilderness Research Station, nestled in central Idaho’s Frank Church-River of No Return Wilderness, has been a vital research hub since the University acquired it in 1970. Accessible only by plane or hiking, it supports wildlife surveys, range land monitoring, and climatology amid over two million acres of protected wilderness.
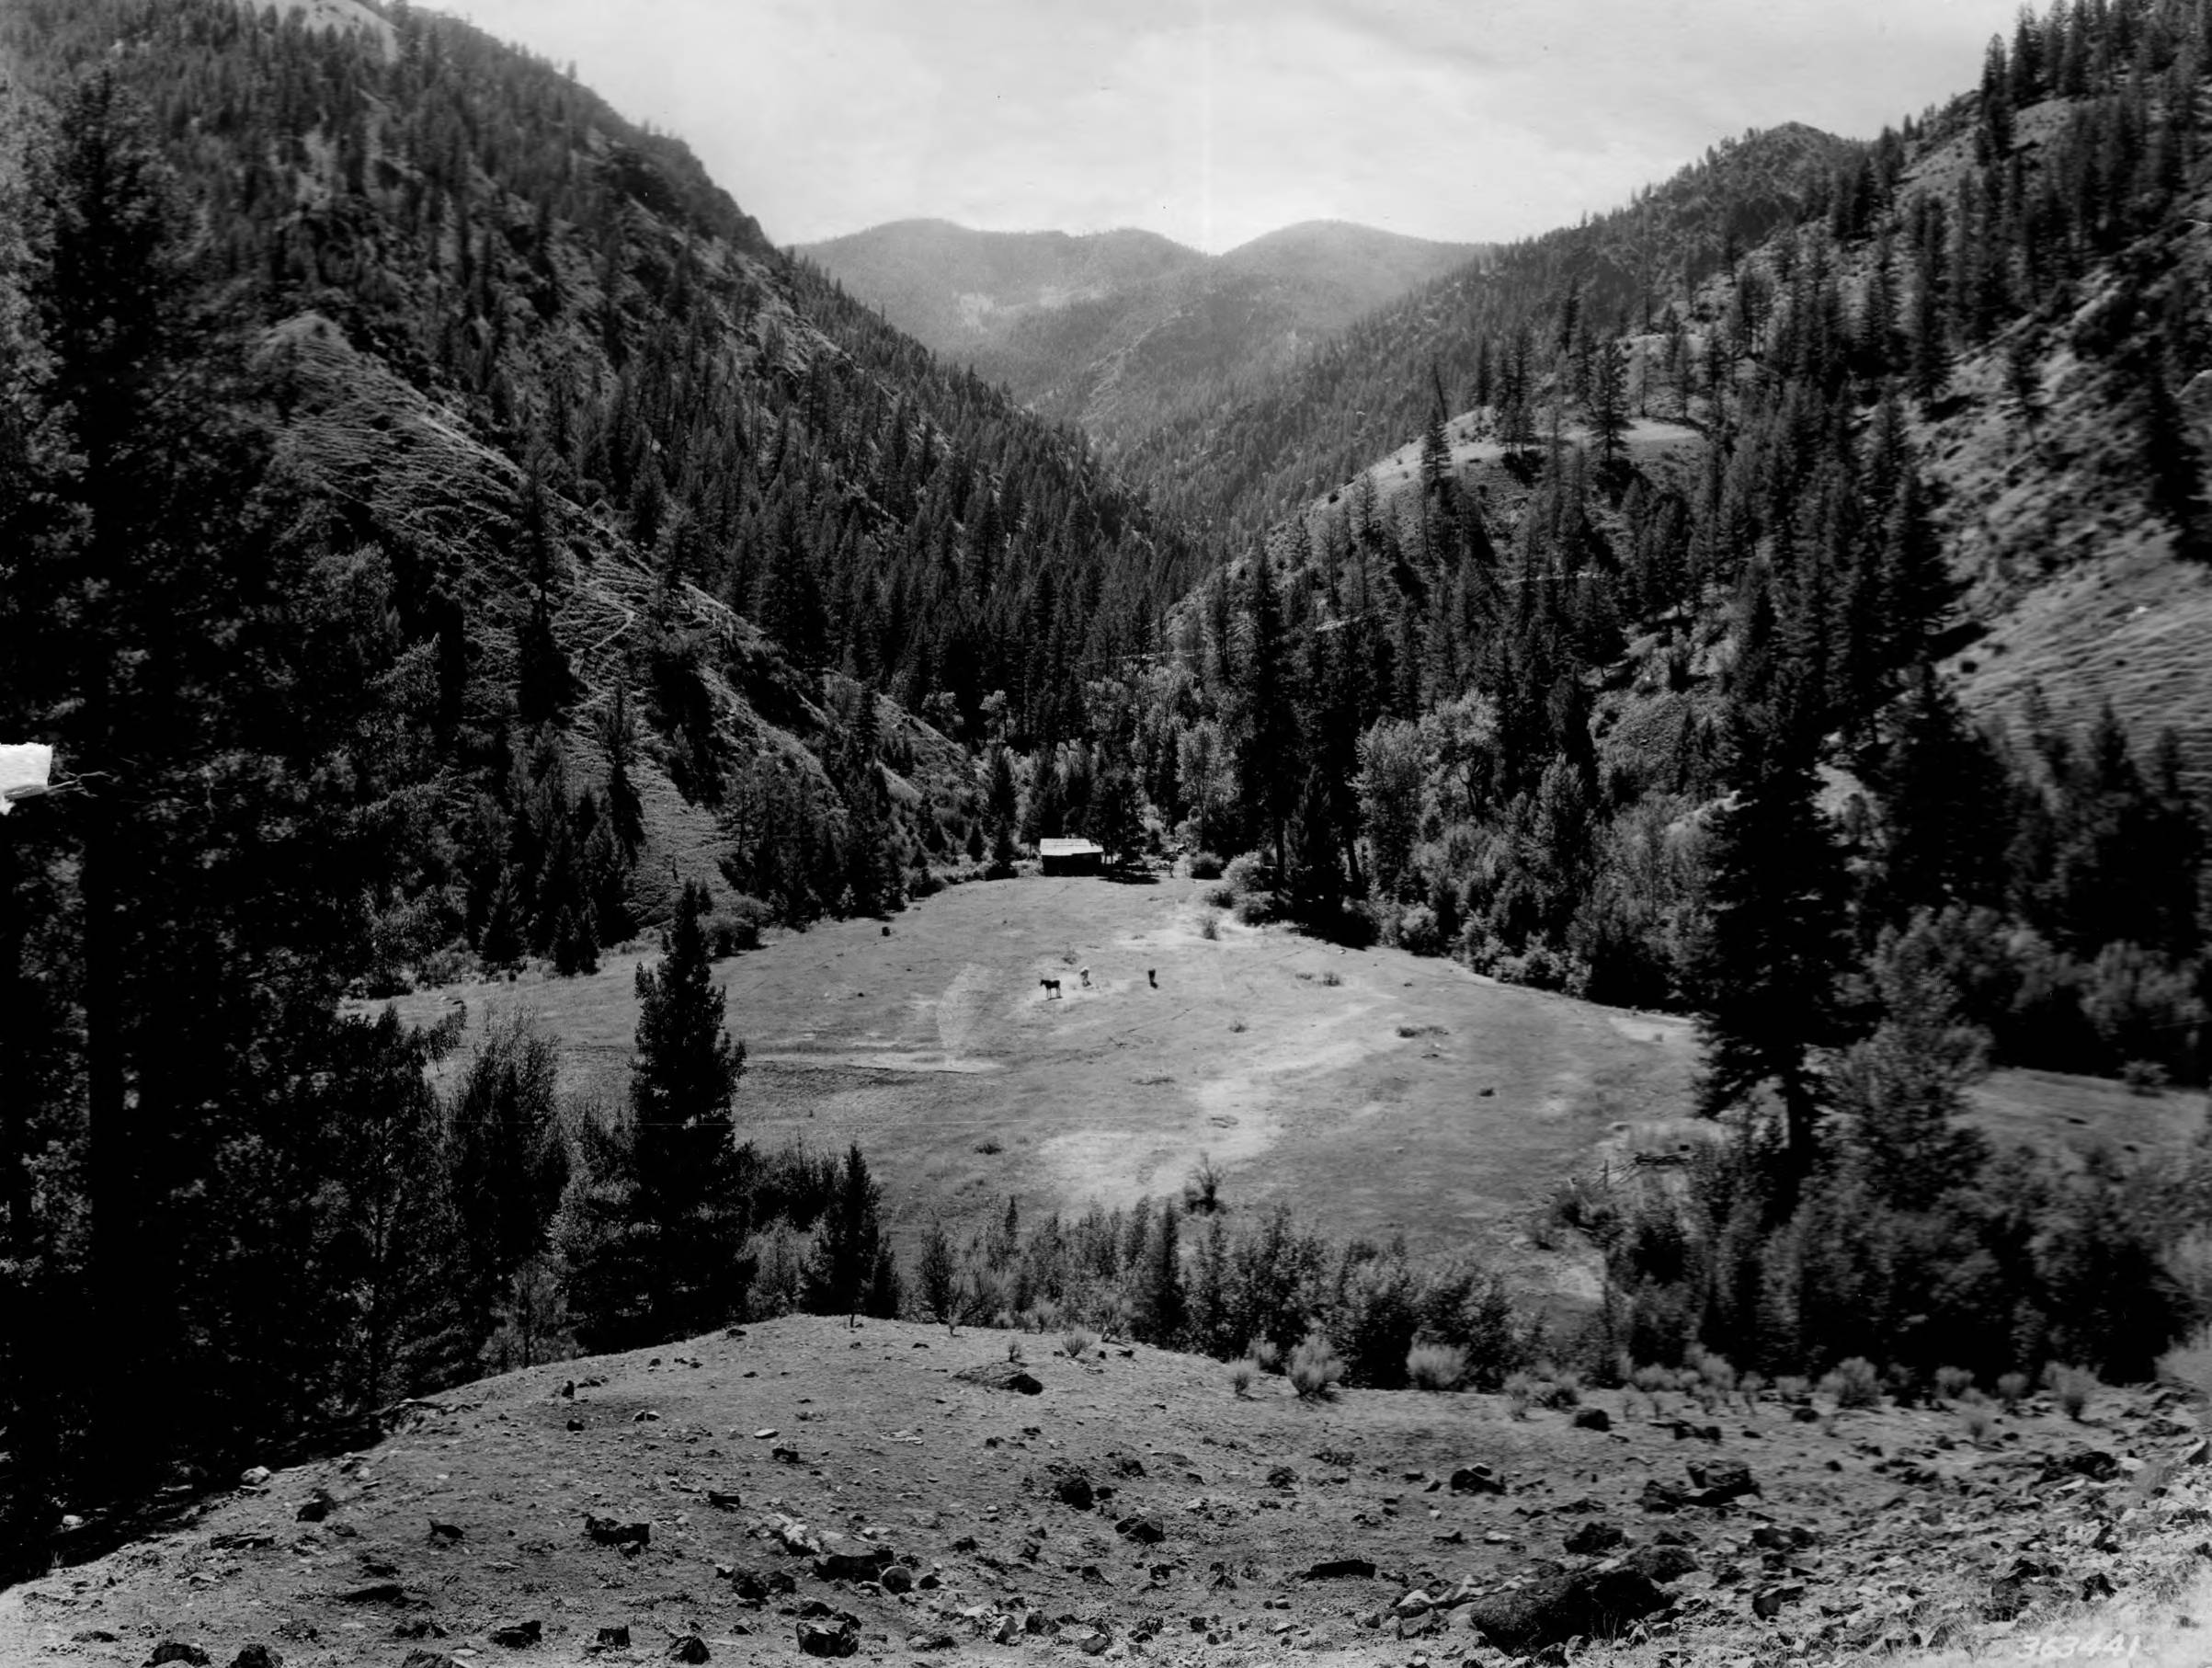
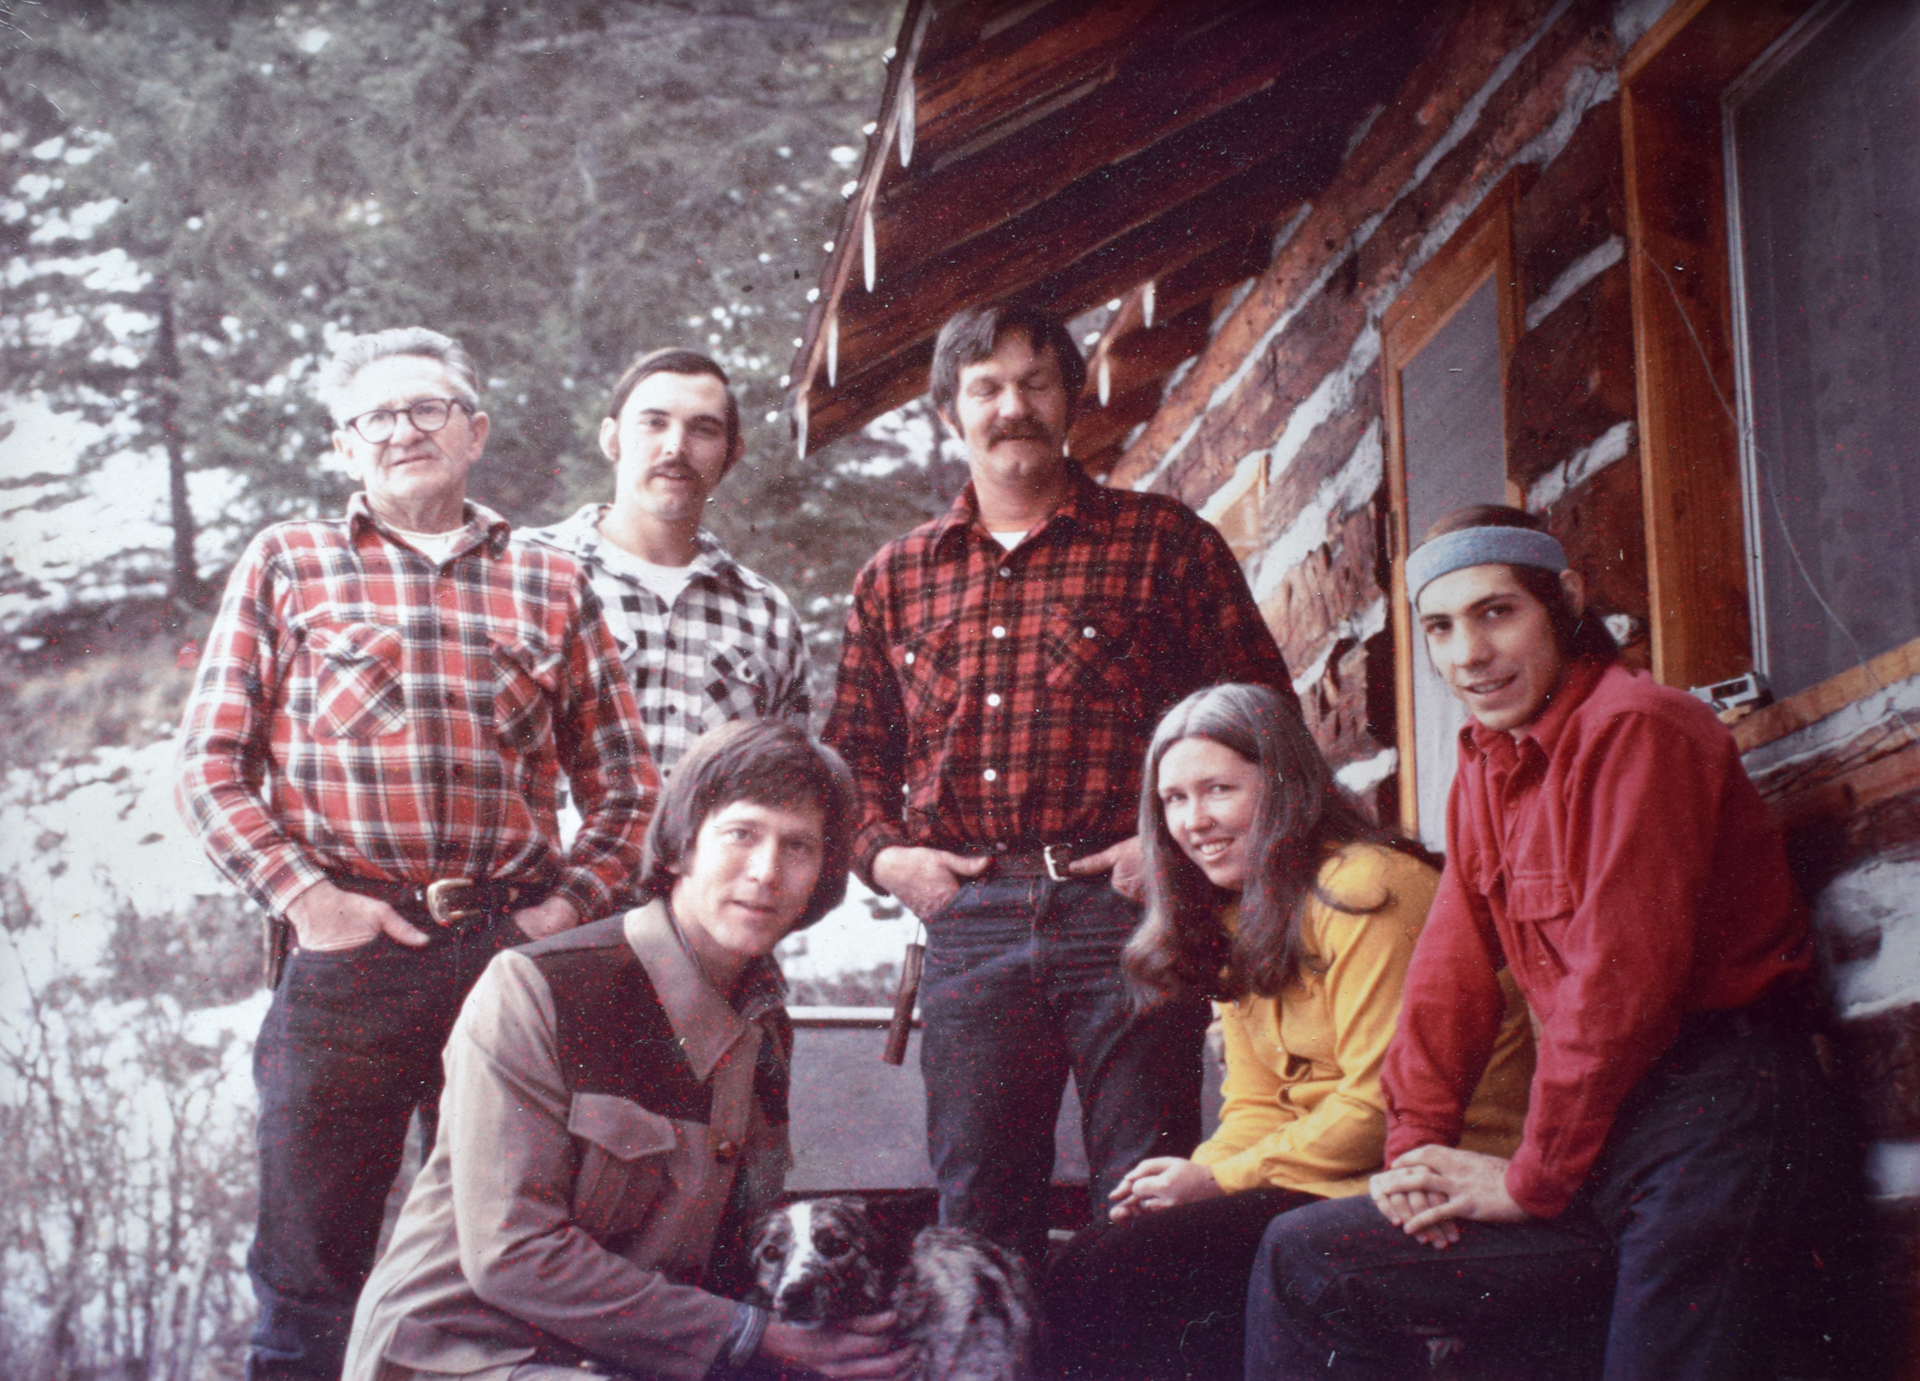
A few years ago, the Center for Digital Inquiry and Learning (CDIL) was contacted by station managers to digitize at-risk scientific papers and internal documents. In a separate project, CDIL Fellowship recipient and PhD candidate Jack Kredell visited people involved in the station’s management and maintenance to uncover “often-ignored social and experiential content behind scientific pursuit.” The project, led by Devin Becker, Associate Dean of Research and Instruction, envisioned a collection combining these two resources. The goal was to provide access to all scientific research produced at the station, along with interpretive material to help visitors better understand its historic, human, and geographic context.
The idea to map the oral history recordings began during a meeting where I brought a list of locations mentioned in the interviews. To identify these informal sites, I connected Google Earth to a monitor, and within minutes, Jack was guiding me through the 3D landscape and there was a bit of a spark as we were understanding the area in a more complete way. After discussing more complex programmatic solutions to link the recordings with geographic data, I decided to simplify the concept by creating a video combining these elements.
I selected the oral history excerpts that I felt uniquely adept at providing a sense of the amount of time that it takes to navigate the area on foot and discussed locations that not only had a geographic scale but a chronological one.
✺
In the first excerpt, wildlife researcher Dr. Maurice Hornocker recounts a four-day search for his colleague’s dog, Little Red. The emotional narrative demonstrates how far one could venture in the area before needing to come back to base. The multi-day structure of the story allowed me to experiment with time-of-day functionalities, another attribute you can manipulate in Google Earth Studio to visualize the rising and setting of the sun over days, months, or years. This adds a dynamic lighting component to the finished visualization and a more nuanced understanding of the environment they were navigating.
In the second excerpt, Dr. Ed Krumpe describes the wilderness area’s history, beginning with modern landmarks, then smaller geographic features, and finally an Indigenous site excavated in 1983. The animation allowed me to use scale and movement to convey the remoteness and historical depth of the region as the recording begins with modern landmarks like the airstrip and the station, then moves to small geographic features like the neighboring creeks, scopes out to massive geological elements and finally to an ancient Indigenous site excavated by U of I archeological teams starting in 1983.
In the Digital Scholarship and Open Strategies department where I work, this experiment has been helpful in thinking about ways that we can marry oral history material with geographic visualizations. We are currently thinking about moving away from proprietary platforms like Google to have more programmatic approaches that will lead to more sustainable data, but this approach is can be incredibly helpful for you as students and researchers where geographic context is key to viewer comprehension.
✺