Getting Started
Contents: Sign-Up | Google My Maps | Adding and Styling Placemarkers | Adding and Styling Shapes | Exporting KML Data
Google Earth Studio is a unique hybrid of geographic information science thinking applied to an animation or visual effects workspace. The browser application is a “tool for animating geospatial information to create still and video content” that uses “the same imagery dataset and the same 3D rendering engine” but is equipped with controls to guide viewers through geographic data and export this media in a variety of forms.
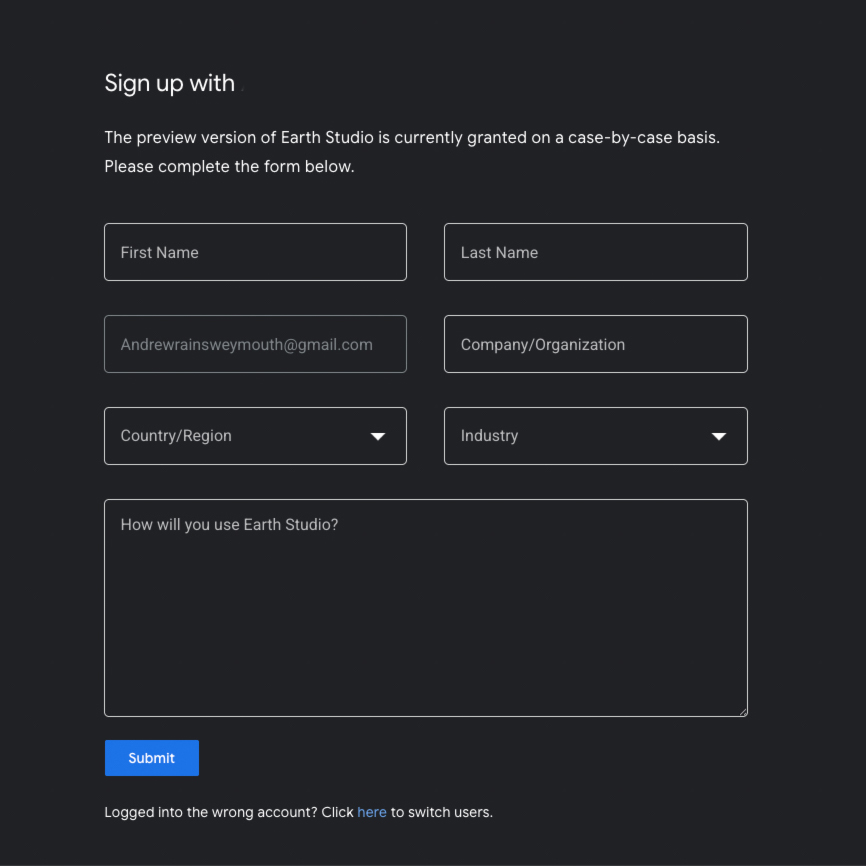
Sign-Up
The only requirements for using GES is that it must be used in not-for-profit purposes and that you must attribute the final product. This takes the form of a watermarked label that is automatically generated when your animation is rendered, the term for the process of converting your composite visual data into a sequence of high resolution frames to create your video file. While you do need to display this watermark, you can control where it is positioned on your video frame during the export process that we will discuss at the end of this workshop. The first step is to visit the sign-up page and fill in what you will be using the platform for. After submitting it should only be a couple of days before you have access.
Google My Maps
Something I found unintuitive when I first started working with Google geographic platforms is how the different initiatives created over time are interrelated or disconnected from one another. This tutorial will guide you through the process of navigating your map to a single destination, rotate around a polygon and fly over a line path. To create any labels for your placemarkers, change the color and icon of the placemarkers or create shapes like polygons and lines, you will need to make them in Google My Maps. The platform, launched 11 years earlier than Google Earth Studios, hasn’t been sunsetted because it is the only Google geographic platform where users can create these custom elements and export them into Keyhole Markup Language, or KML, an XML based file format to represent geographic coordinates. You will also see the option to export in KMZ, which is simply a zipped, compressed version of KML.
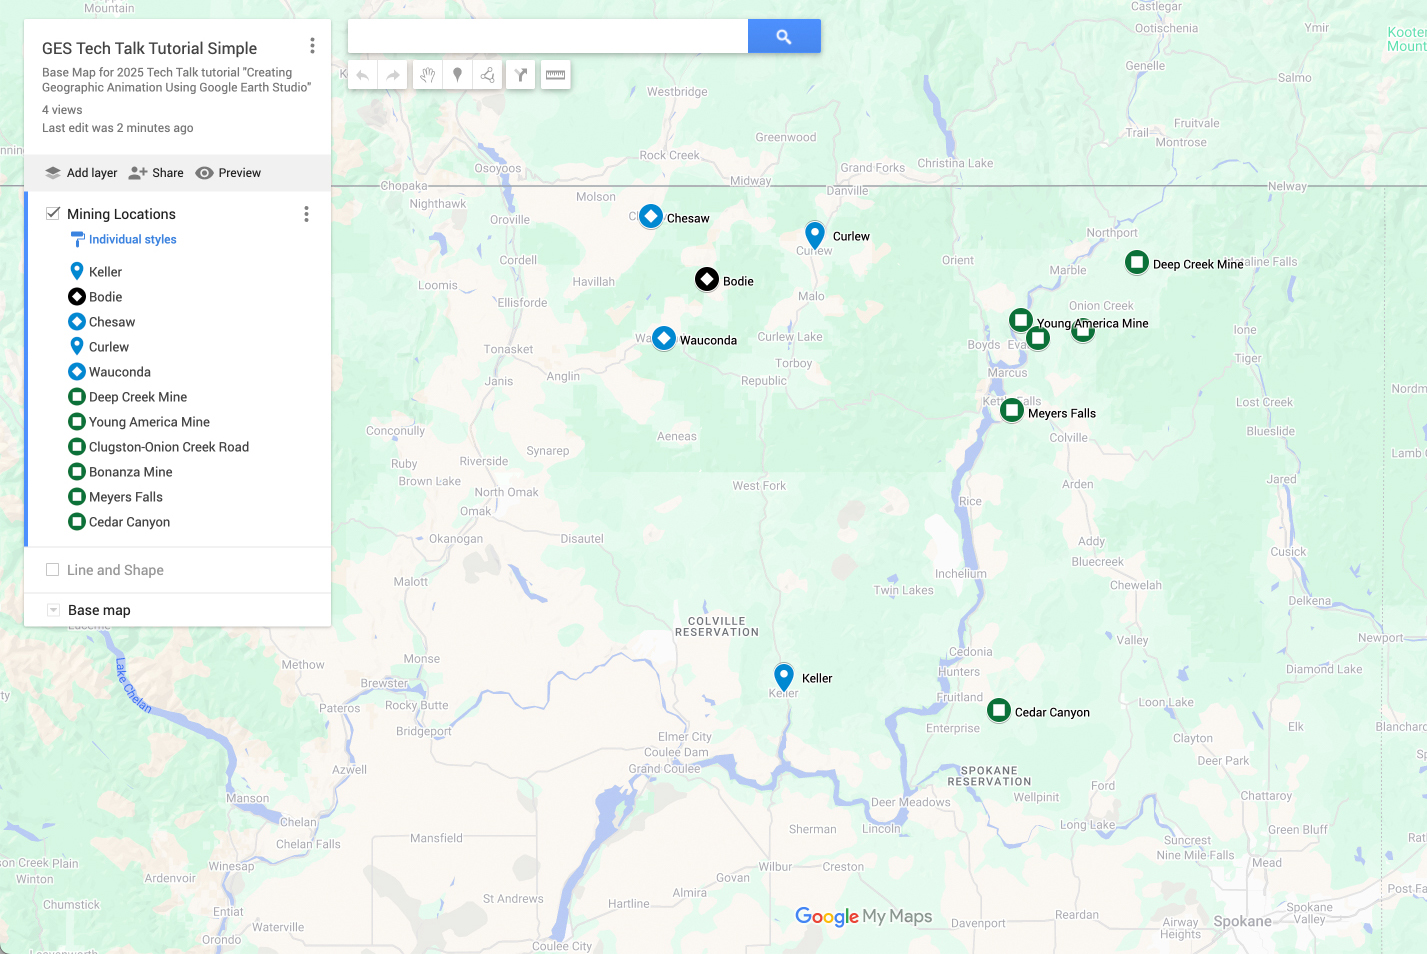
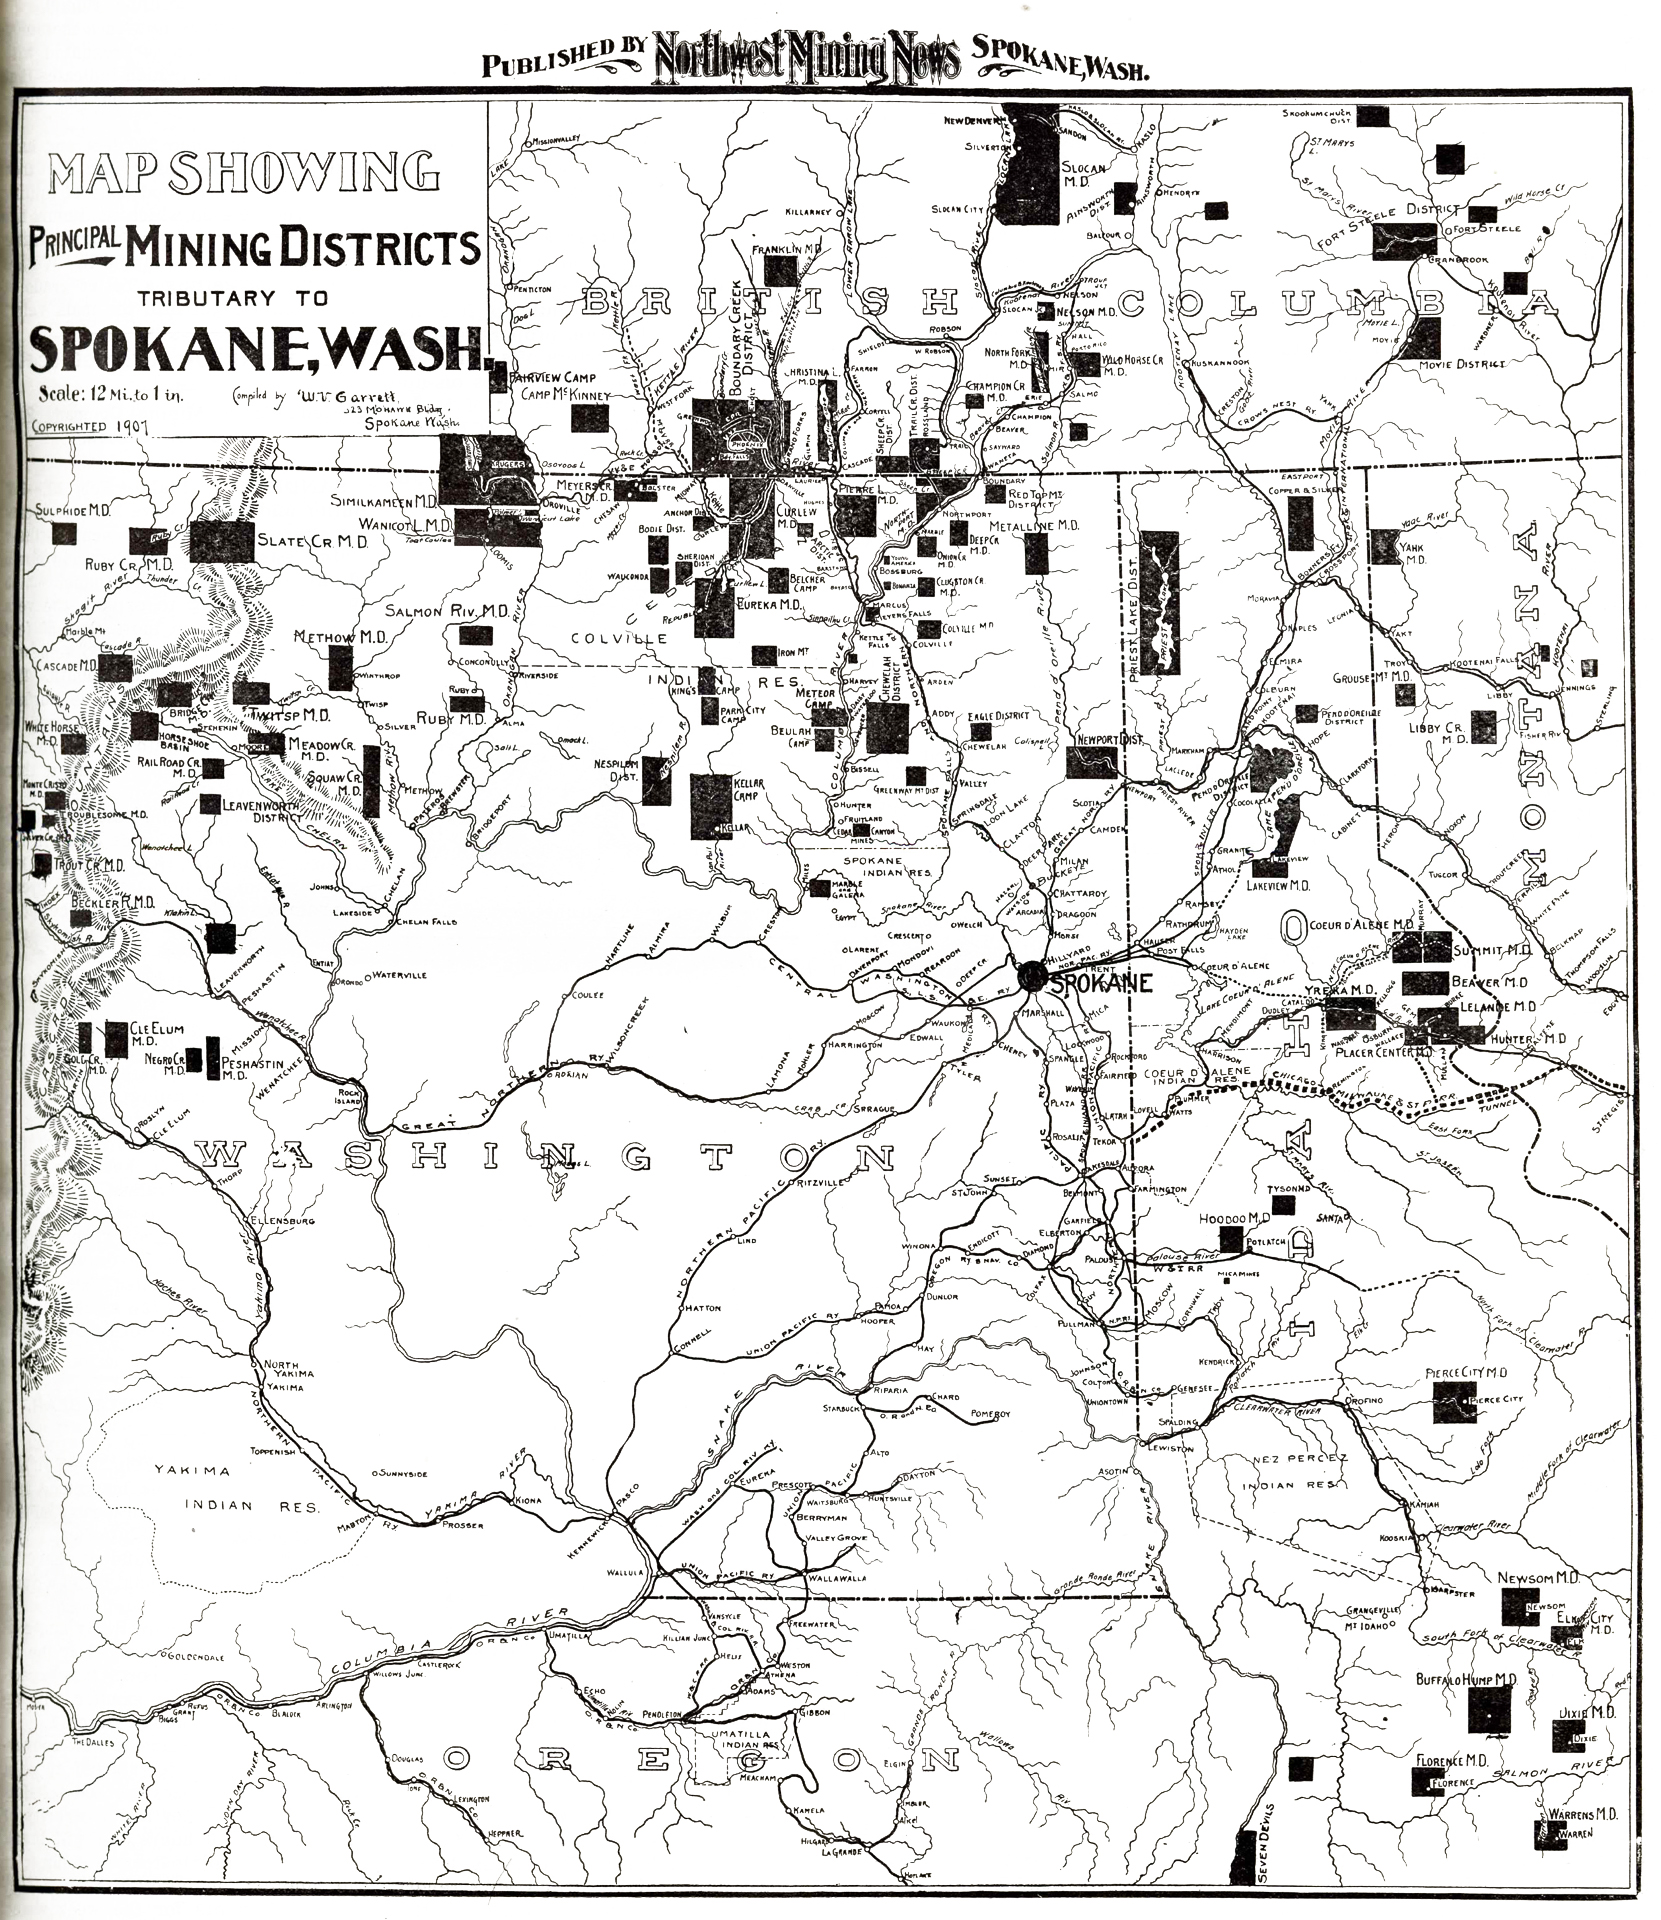
If you have a working google account, you will be automatically signed into My Maps with that account and your projects will be saved under it. For this exercise, I thought it might be interesting to build this test around a map of mining locations north of Spokane from the Northwest Mining News magazine from 1907.
✺
Adding and Styling Placemarkers
Looking at just a few of these locations that will allow us to create some lines and shapes, you enter either place names or latitude and longitude into the search bar, or select the placemarker icon below for a custom location. Pressing enter, a placemarker will appear. Selecting the plus sign on this pop-up will Add To Your Map, which will be associated to your Untitled Layer by default.
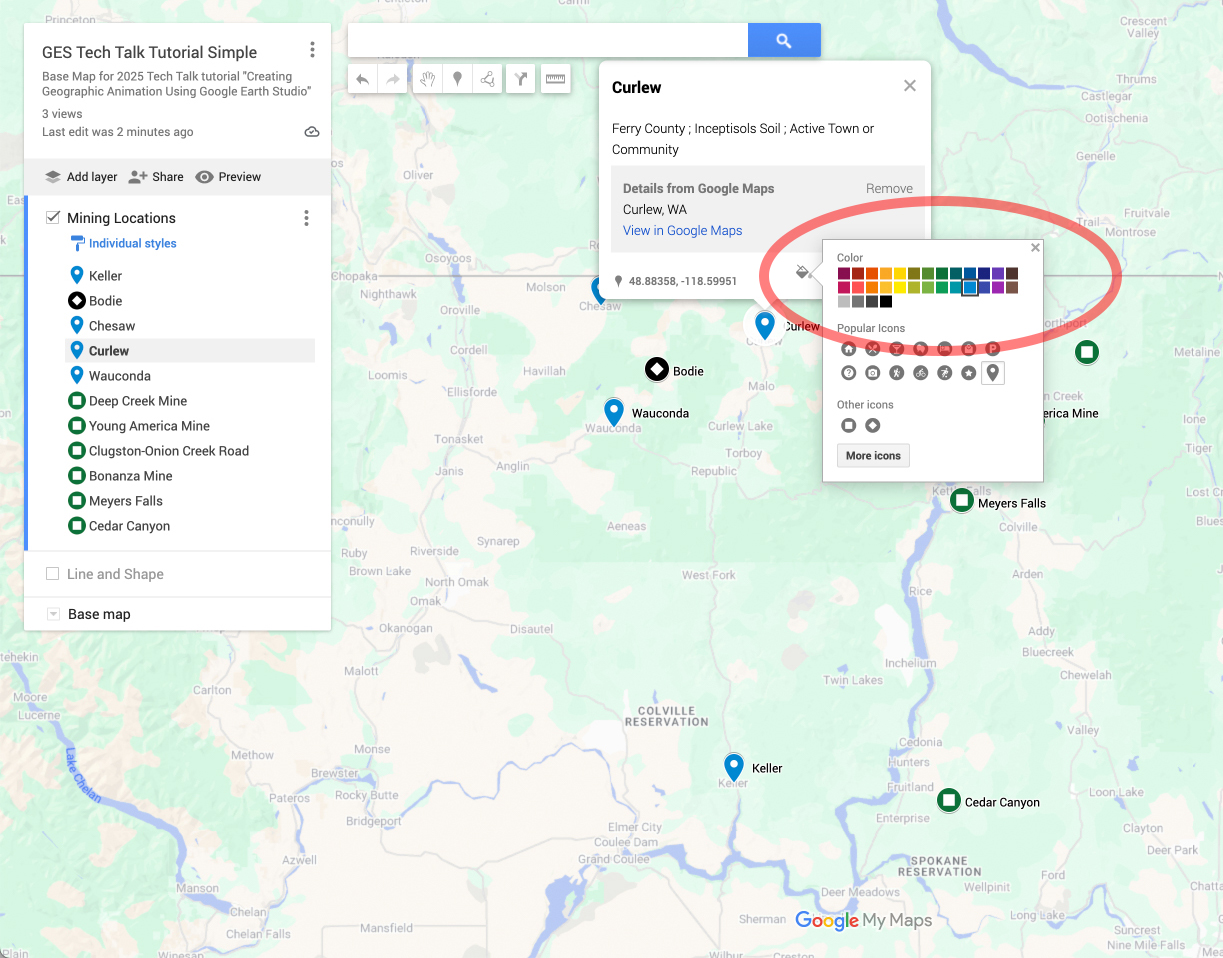
Selecting the placemarker, you can change the styling of the color and icon with the paint button symbol or adjust the label or description of the item by selecting the pencil icon. Note that metadata you put in the description field or images you attach with the camera icon will not generate in GES (although they will in Google Earth). If you want to adjust all of your labels quickly and efficiently, you can select the ellipses to the right of your layer title and choose Open Data Table, which will display your label and descriptions like a little spreadsheet.
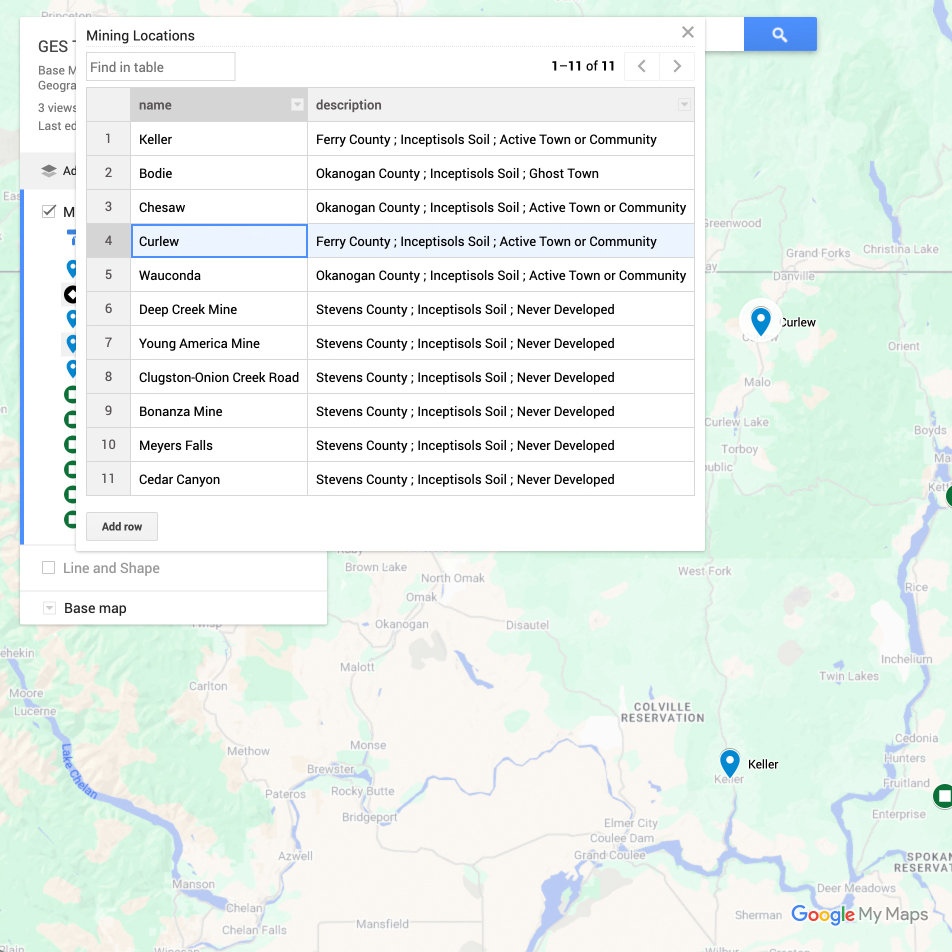
Though you can’t carry over descriptions into GES, you can translate some of this metadata visually. In this map, places in blue are still active towns, black are ghost towns and green were never developed. The pin shaped icons are in Ferry county, diamonds in Okanagan and squares are in Stevens county.
Adding and Styling Shapes
Now that we have our places, go back to the menu on the left of the screen and select Add Layer. Below the search bar, select the icon with the three dots connected by a line. To draw a line, simply select where you want to go and press enter when you are done. To create a polygon, repeat those steps but connect the last node to the first one you created. Polygons can help highlight distance, natural resources and connectivity between places. In this case, we might be able to understand the distance of a mining district, long term economic influence and geological formations by highlighting this cluster of mines in northern Washington.
Note
Be less sloppy than I am here and zoom in to your destinations before drawing to get more precision!
Exporting KML Data
Now that we have our labels on one layer and our shapes on another, select the ellipses to the right of your project title and select Export to KML/KMZ and download the Entire Map.
✺