Google Earth Studio
Contents: Easing | Pausing | Single Point | Polygon | Line | Time of Day | Export and Embed
A couple of days after signing up, you should be notified that your account has been approved. Opening Google Earth Studio may bring you to an interstitial page where you can select which google account you are using, which will then direct you to this introductory page:
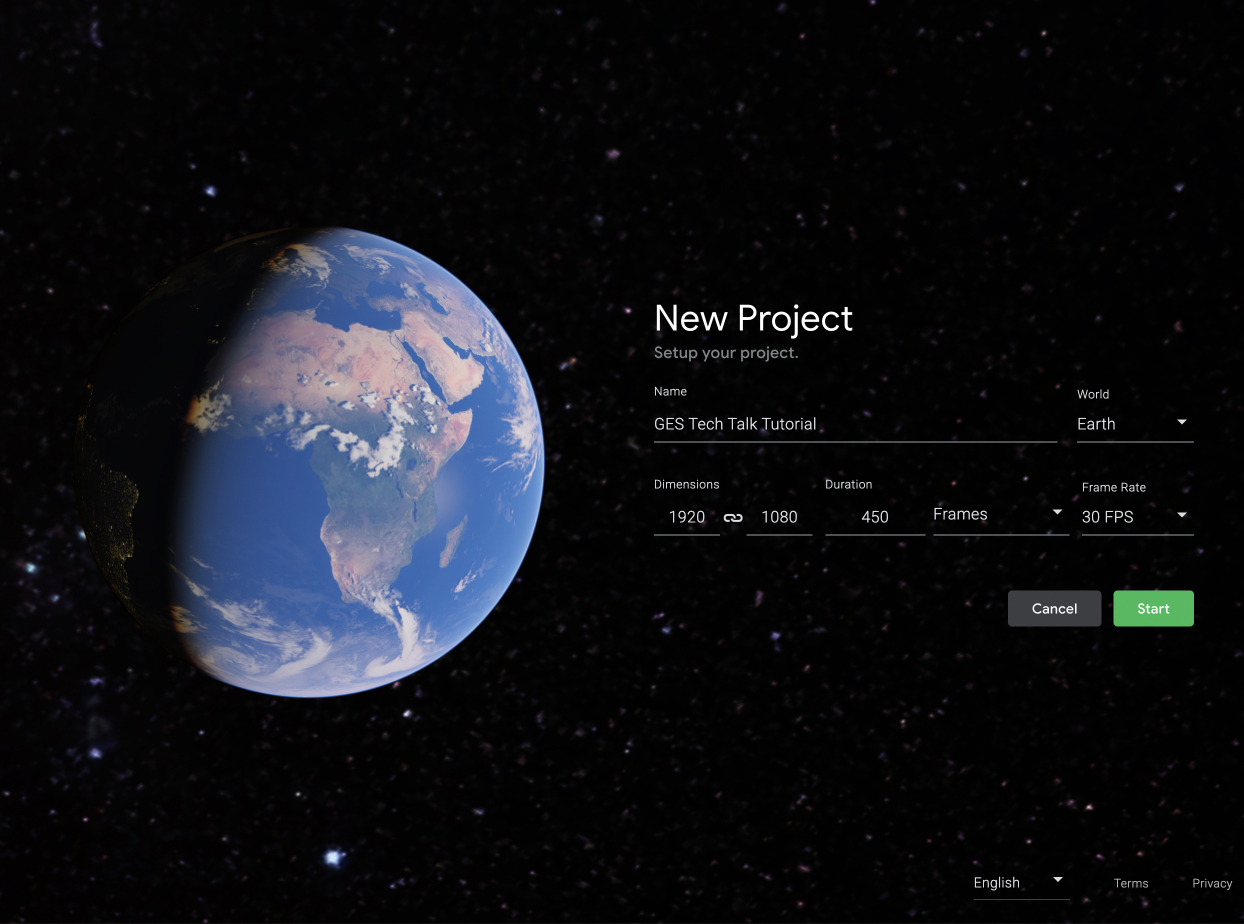
If you select the dropdown on Blank Project, you will see GES has a series of Quick Starts, which are an excellent option if you would like to experiment with zooming into and orbiting around just one object or jumping from one point to another. For this test, we will be selecting the Blank Project option.
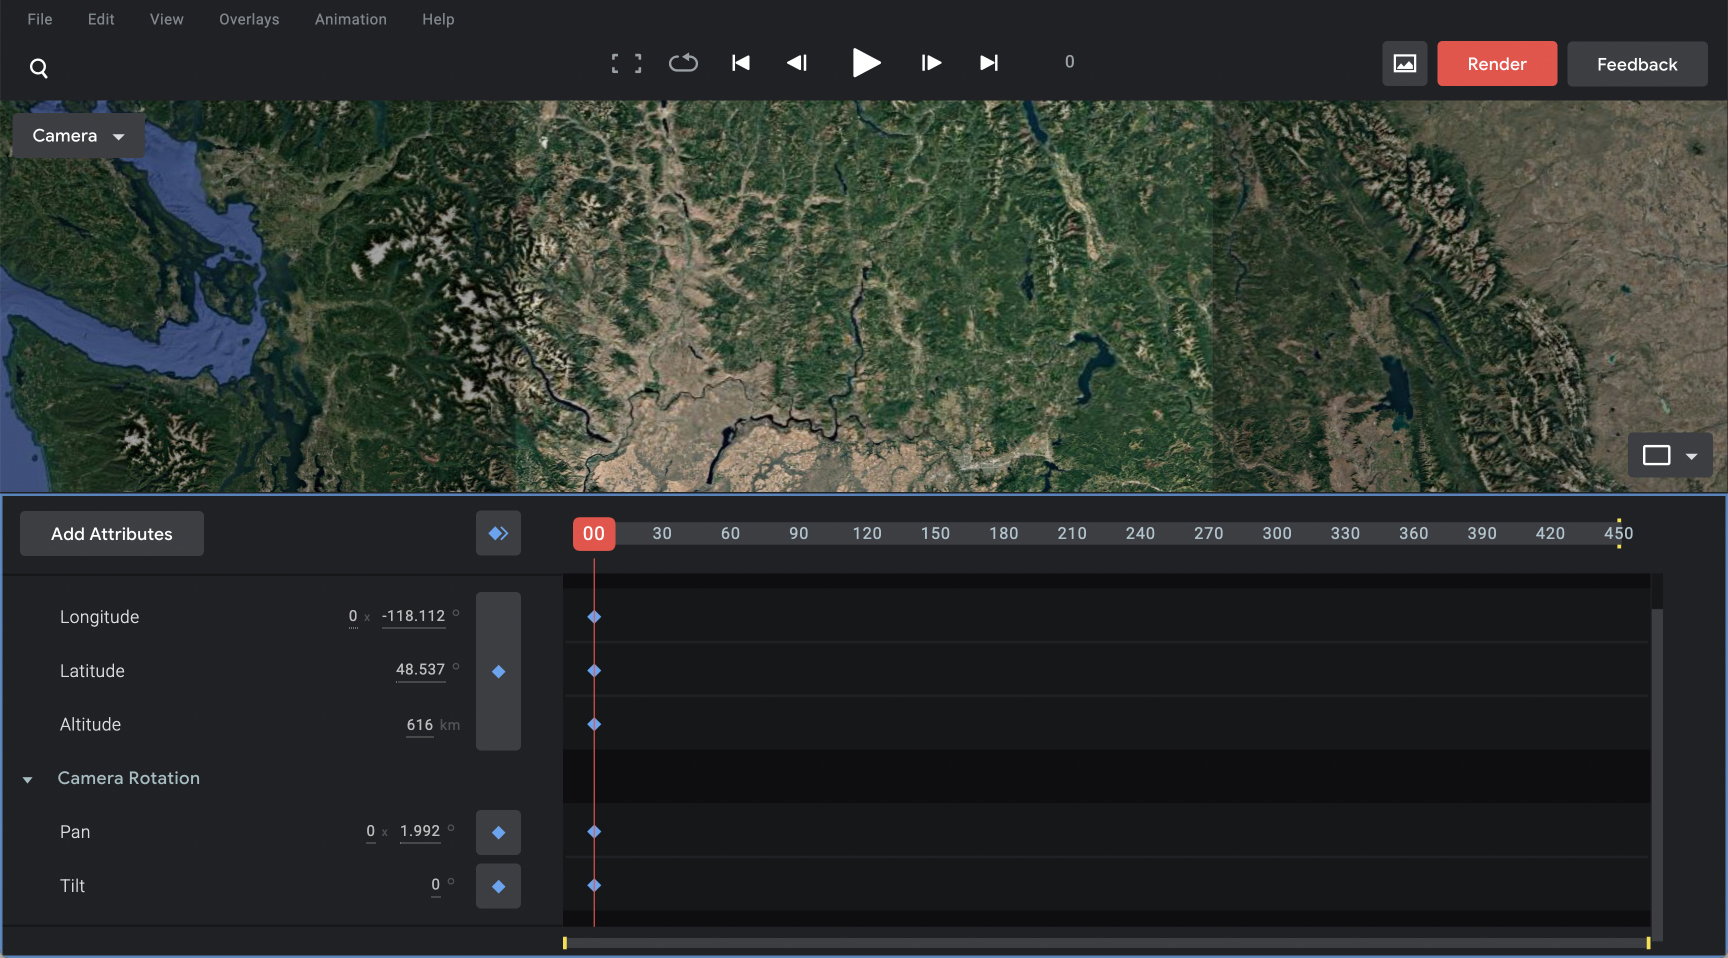
The conventional orientation controls are replaced with the following geographic analogues:
- Latitude = Y position (north-south)
- Longitude = X position (east-west)
- Altitude = Z position (elevation)
- Pan = Y rotation
- Tilt = Z rotation
Movement is established by creating keyframes that manipulate these characteristics along the timeline. The quick key to generate a keyframe is control + Enter. One thing that takes a little getting used to is that you either have the timeline or display section selected. If you would like to add changes, you need to scroll forward, select the display, make your adjustments and then add keyframes. If you forget to add keyframes and select back into the timeline, those changes aren’t recorded.
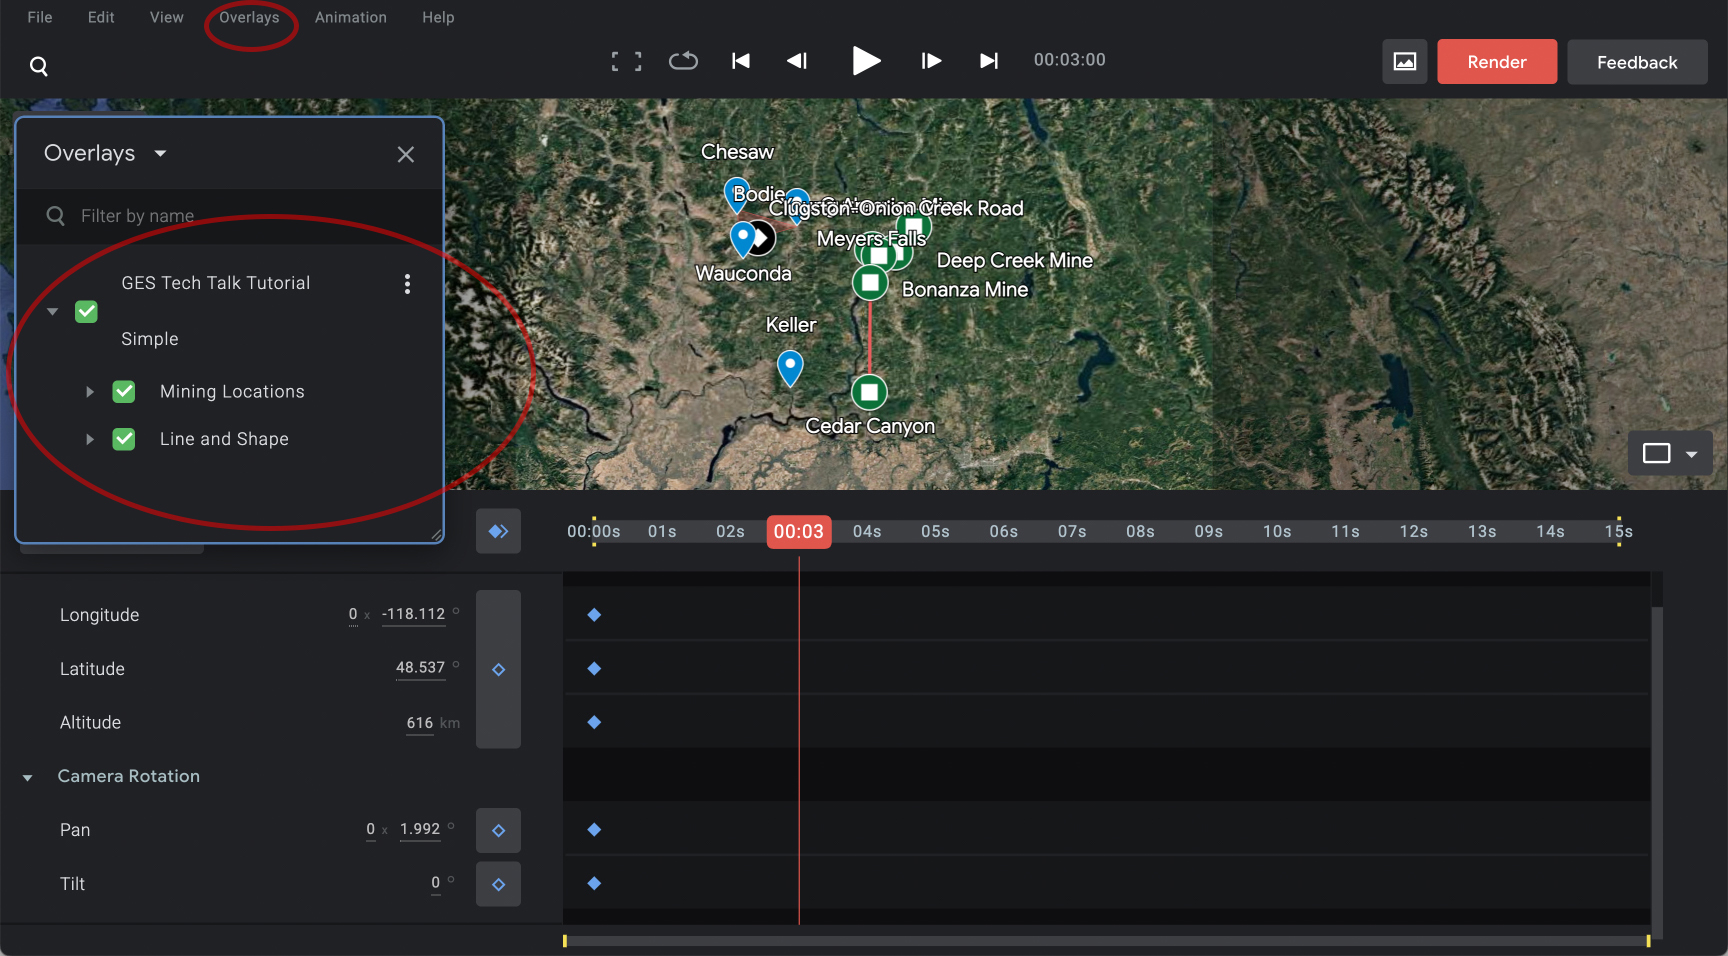
Select File>Import>KML File to import labels and shapes from Google My Maps. This will import your different layers you’ve created as well as the ability to toggle their visibility on and off in the Overlay pane.
Easing
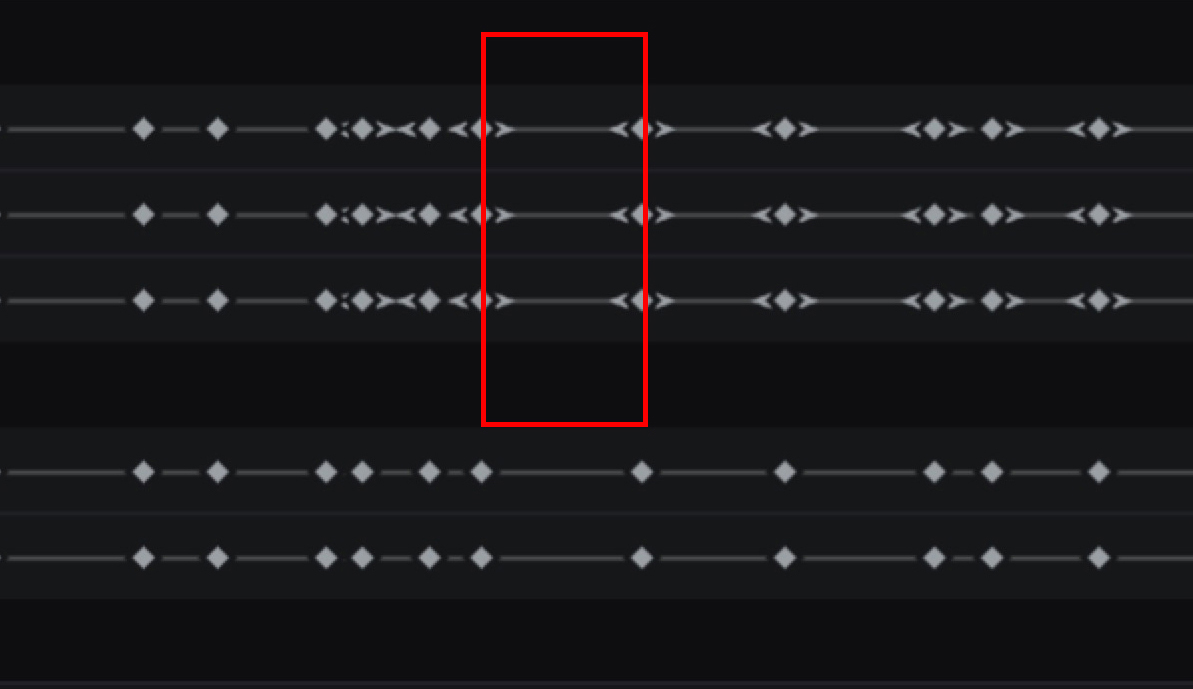
You will notice that, by default, GES adds an “auto-ease” characteristic to keyframes and you link them. Easing in and out slows you down before you reach your keyframe and as you leave it so the movement is less jarring for viewers. This is generally a good thing except for when you are duplicating keyframes to pause, where this effect is distracting. To resolve this issue, select all of the keyframes and choose Linear.
✺
Pausing
One important thing to keep in mind is that you need to give the viewer long enough to read the labels of destination. In the case of the single destination, we will be stopping briefly to read and for the line and polygon, we will be slowing down quite a bit for visual legibility. The easiest way to make one of these stops is simply to copy your keyframes from the timeline, move a couple of seconds down and then paste.
I find that it is more natural and dynamic to have a very slight movement during these reading pauses than a completely static, robotic shot, so I will subtly pan left or right or tilt up or down by selecting the display and adjusting tilt and pan slightly with the Shift + Arrow keys, then Control + Enter to record these changes / update your keyframe information.
Single Point
We can do the first “point to point” zoom into Keller by either pointing your mouse and scrolling forward or hitting + to zoom in. Once you have an appropriate zoom, you can manipulate your angle using the Shift + Arrow keys.
This brings us to the more precise way you can manipulate movement between points: the dual display. Selecting the box icon to the right above the timeline, choose the 2 option, which will open a window on the left that displays either your x or y axis and iron out any potential errors. By selecting the node that represents different sets of your keyframes, two dots will emerge on either side, representing the “easing” effect, which can be lengthened or shortened depending on your desired effect. The red triangle with a white triangle represents the camera perspective.
✺
Polygon
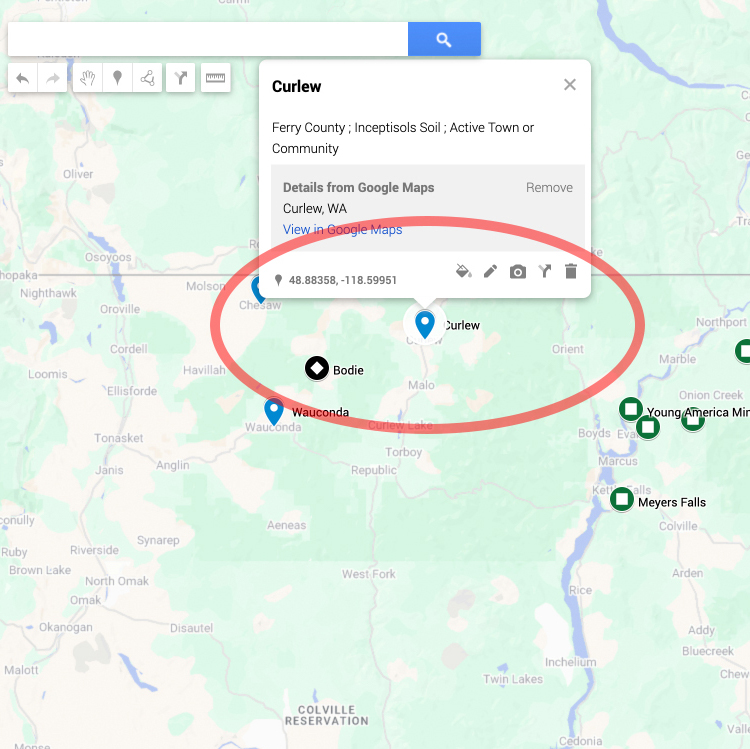
So now that we have paused briefly at a destination and subtly titled over about three seconds so that the viewer has a moment to read the placemarker and understand the geography, let’s jump over to where we will be revolving over our polygon of four locations. Rather than hunting around on the map, I will generally keep the My Maps tab open while I am working in GES and just copy the geographic coordinates from the bottom left of the card and then plug that into the GES search bar.
If you are moving across large distances and moving into close range at both destinations, you may find that you accidentally slip under the map as you are going through mountain ranges. To avoid this confusion, and also make the point to point movement a little more legible for viewers, I recommend adding a “hop”. Simply go to a midpoint between your start and destination keyframes, select the viewer to manipulate coordinates and select the minus key or scroll out to increase elevation.
Once you are in the region you need to work, it’s generally going to make for smoother viewing to simply navigate around your destination with your keyboard rather than entering geographic coordinates in the search bar, which will drop you in at a default perspective and elevation every time. To rotate around the polygon, simply rotate around the shape. Unlike the previous single point, I am not pausing at each point, instead, I’m just slowing down to around three seconds between each keyframe and pausing briefly to an overhead angle to see all of the points together before jumping over to the straight path.
Line
For the line, I will do the opposite movement: beginning at a higher elevation and more overhead perspective to see everything at once, then moving closer and more parallel with the ground for greater detail. Because you can create any shapes in My Maps, you could potentially highlight complicated topographical elements in really engaging ways using this tool.
If you want to end in the same place you began, simply copy your first keyframes and paste them at the end. Significant zooms like this can be a little unbalancing, so I recommend untangling things in your x and y perspective dual screen to the extent you can.
Tip
For both rotating around the polygon and following the line path, I first created keyframes for every placemarker (and even some between them) and then experimented with deleting keyframes or removing easing on keyframes to get the smoothest movement.
✺
Time of Day
Adding the time of day attribute is a great way to make your visualization more dynamic and add a temporal element if you want to convey a sense of change over time. As people in a Pacific time zone, the one tricky element is that this is set to British Greenwich Mountain Time (GMT) with no way to change the time zone. Here’s a table to help:
| Local Time (PT) | GMT / UTC Time to Enter |
|---|---|
| 6:00 AM | 13:00 |
| 7:00 AM | 14:00 |
| 8:00 AM | 15:00 |
| 6:00 PM | 01:00 (next day) |
| 7:00 PM | 02:00 (next day) |
| 8:00 PM | 03:00 (next day) |
This is one element where I find it helpful to enter the Graph Editor View by selecting the Time attribute on the bottom left of the interface. To create a gradual movement of morning to evening, create a keyframe that is something like: 06/01/2025 13:00 for 6am Pacific, then another keyframe at the end that is: 06/02/2025 03:00 for 8pm Pacific. If you want to create a sped up evening in the middle of a map, such as between the polygon and the line, create an evening keyframe and morning keyframe at these points and then change your final keyframe to one day later to end at 8pm the following day.
Selecting the cloud attribute is another way to make a geographic visualization more dynamic but note that both this and the time are based on sun angle calculator tools and static imagery (as opposed to satellite or real time elements).
Note:
These elements can make geographic elements less clearly defined, so use at your discretion!
✺
Export and Embed
To export your project to an MP4 file, select the red Render button on the top right of the interface. By default, this will export your entire project in high quality as a widescreen video (1920x1080). If you’ve designed everything within the square frame of the default camera view, you can also export 1080x1080 for a square video by selecting the link icon and adjusting dimensions.
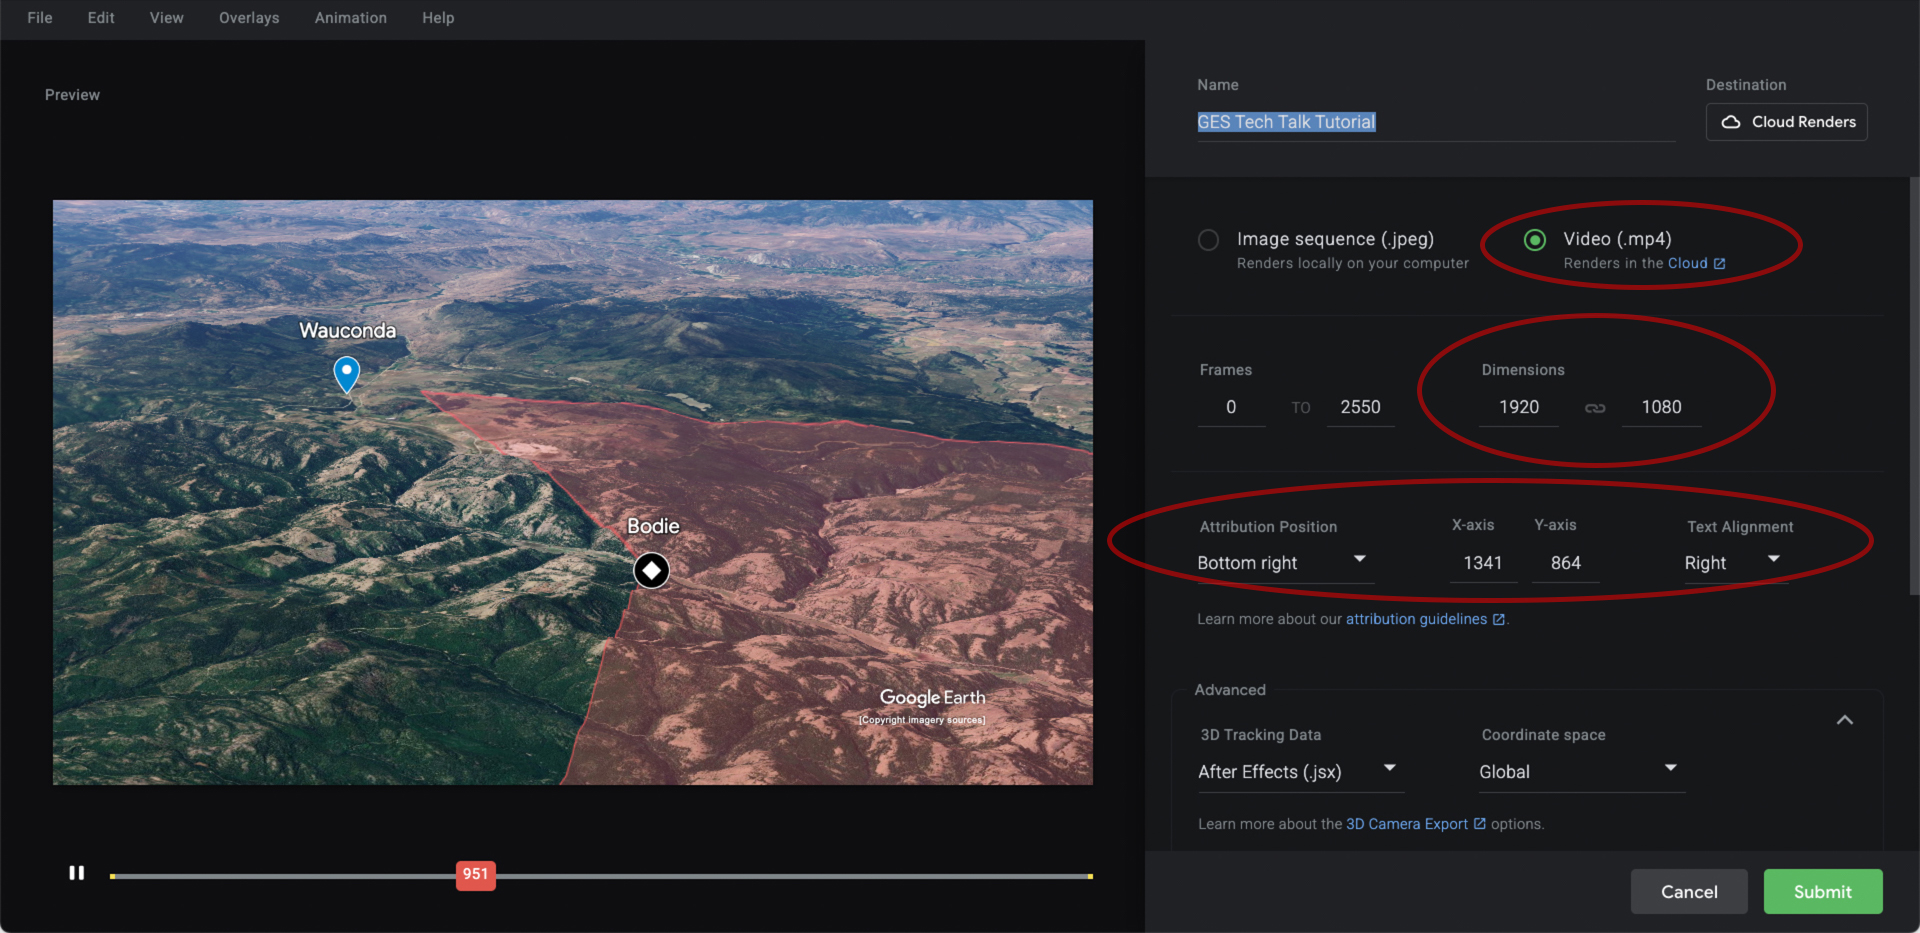
The preview window will automatically adjust to this view for review. Select the green Submit button to send to the Cloud Renders. Once the render finishes, you can either go to Animation > Cloud Renders in the GES interface or go to the gmail account you are using, where you will have an email and download option sent to you.
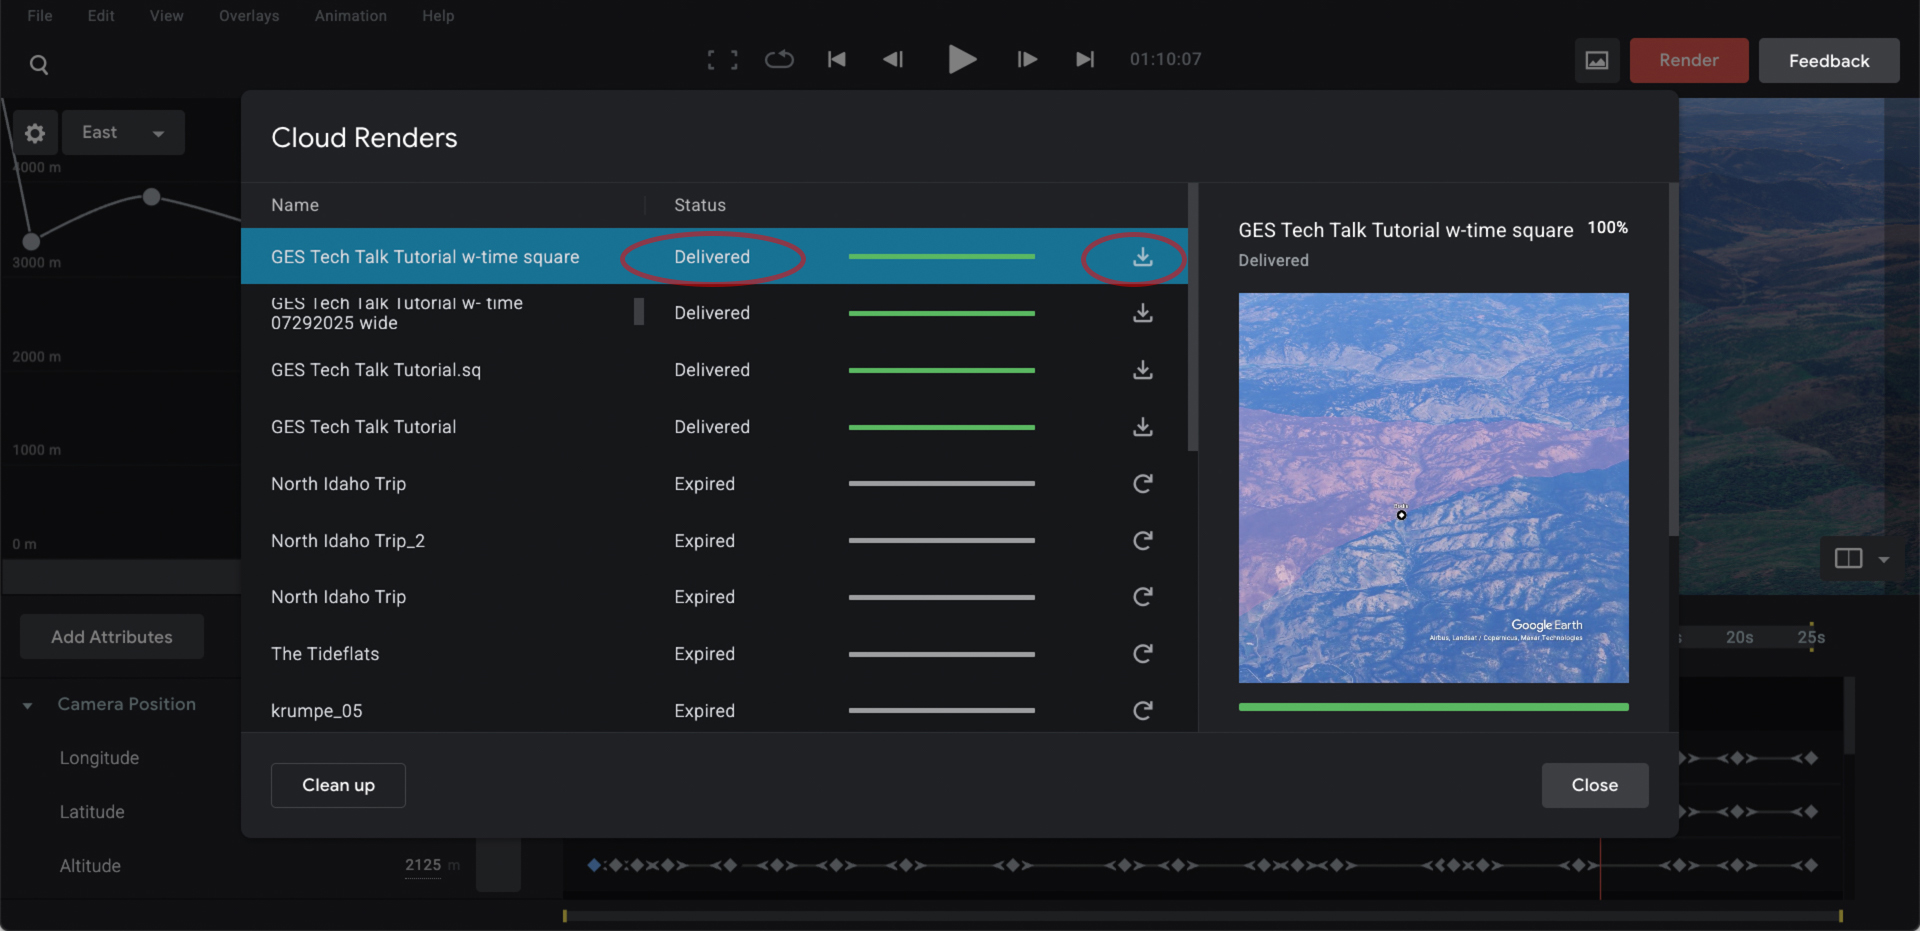
On the Cloud Render window, if you scroll down below your image preview, you will see an “Additional Files” section with a javascript XML or jsx file. This can be imported into Adobe AfterEffects to recreate camera paths, timing and keyframes along with image frames for further 3D manipulation. Additionally, the finished export can be brought into simpler platforms like Adobe Premiere to add labels and edit between sequences (but remember that the watermark still needs to be visible for use).
From this point, your project can be uploaded to social media hosting sites like YouTube or Vimeo or embedded on your site if you are using site building platforms like our own at the U of I, CollectionBuilder. Let me know if you would like to learn more about the latter and I can connect you with materials to get you started!
Conclusion
I hope this has been a practical tutorial on using this tool to make the way you present your research more dynamic and intuitive.
About the Author
Andrew Weymouth is the Digital Initiatives Librarian at University of Idaho, primarily focusing on static web design to curate the institution’s special collections and partner with faculty and graduate students on fellowship projects. He has also created digital scholarship projects for the universities of Oregon, Washington and the Tacoma Northwest Room archives, ranging from long form audio public history to architectural databases and network visualizations. He writes about labor, architecture, underrepresented communities and using digital scholarship methods to survey equity in archival collections.