Introduction
Hello, my name is Andrew Weymouth and I have worked with the University of Idaho Library as the Digital Initiatives Librarian in the Center for Digital Inquiry and Learning (CDIL) department since the fall of 2023. My work generally consists of creating and maintaining our digital collections, working with CDIL fellows, helping to rethink processes and introducing new digital scholarship tools to the department
✺
Why Use Digital Scholarship Methods?
Digital scholarship (interchangeable with “digital humanities”) refers to academic work that leverages digital tools, methods, and platforms to conduct research, present findings, and engage with both scholarly and public audiences. It encompasses the use of digital technologies to enhance traditional research practices and introduces new ways of creating, sharing, and analyzing knowledge.
As we will explore today, digital scholarship consists of selecting only certain parts of the data you have assembled and representing that data in different ways in order to draw out new insights and connections, help people understand new dimensions of your findings during the presentation stage and also create accessible material online so potential collaborators can learn more about your work.
We will be looking at how to analyze the same data:
- Chronologically (using a timeline)
- Geographically (using a map)
- Audibly (using a digital audio workstation)
- Relationally (using a database)
- And narratively (using a digital, mixed media essay)
All of the tools and platforms that I will be talking about today are completely free. These are structured from low to slightly higher barriers of entry regarding technical capability. Since this is an overview of digital scholarship methods more generally rather than a tutorial, I will be simplifying the processes for the two CollectionBuilder platforms I will talk about towards the end but we have great, thorough walkthroughs that can either be explored in video or written format depending on your preferences at the link on screen.
✺
Media and Metadata
I will be using one set of media with (almost) all of the different platforms and methods we will be looking at today so we can identify which ways of looking at data work best for what material. All relating to the United States women’s suffrage movement, we have:
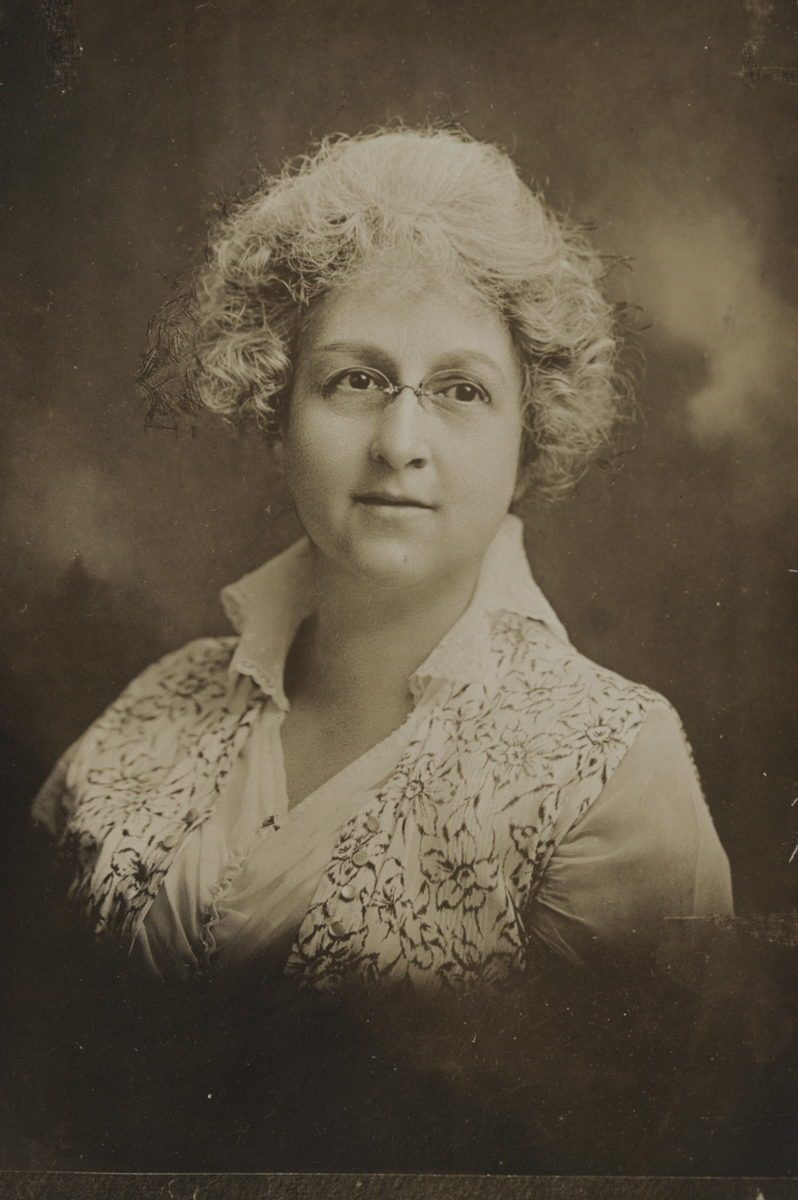
- An image of Grace Darling Mackey, wife of Governor John T. Morrison and prominent member of the advisory Council of the Congressional Union for Woman Suffrage from 1915 somewhere in Idaho

- An audio file of “Fall In Line” (Suffrage March) by the Victor Military Band recorded on July 15, 1914 in Camden, New Jersey
- A pdf of a pamphlet titled “What Kind of Men Want Women to Vote, and Why,” from a 1910 publication of the Connecticut Woman Suffrage Association
- And a video file of a 1913 black and white newsreel of 14 suffragettes as they go to Washington to protest the women’s right to vote from Newark, New Jersey.
✺

Crucially, we also have the full, formatted metadata here on Google Sheets that we will be using selectively with all of the platforms today, beginning with Timeline.js.