Geographic
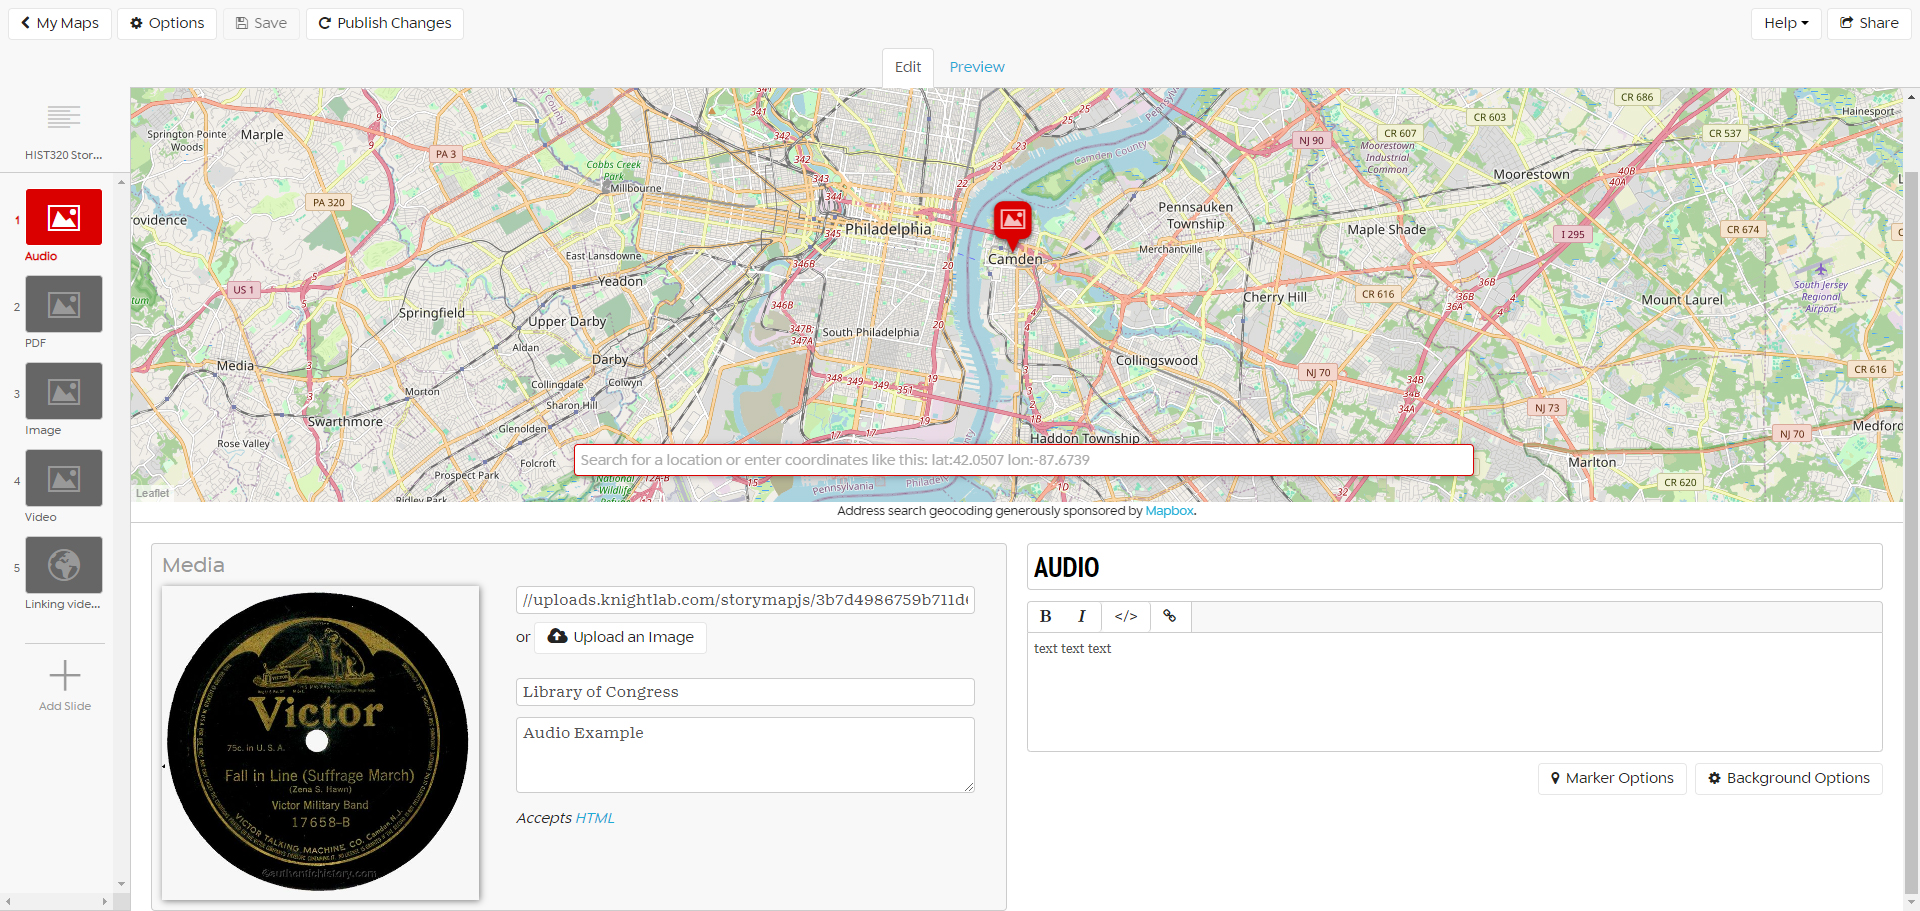
In a way, StoryMaps is even more intuitive than the KnightLabs Timeline.js, with no spreadsheet necessary to create an interactive map that readers can use to understand your research geographically. Instead, you simply plug in your title and text for each frame, upload or link the media you would like to have alongside the map visualization and enter either a place name or latitude / longitudinal data.

Then you save and publish changes to update your document. You create StoryMaps using a Google account which is how you save and retrieve different projects.
✺
Here is the resulting output of our four media items through the framework of StoryMaps:
✺
Unlike Timeline.js, StoryMap does not allow you to upload playable media. You can link to playable media but you will need to play it within the interface of the site it is embedded in. As you can see in the final example of this StoryMap, this can produce less than ideal (inaccessible) navigation, when these elements are viewed on partially full or mobile screens.
StoryMaps is best suited for presentations where placing the reader in physical space is key to understanding the story and favors more long form text and accompanied by static images.